29
/es/
es
AIzaSyAYiBZKx7MnpbEhh9jyipgxe19OcubqV5w
April 1, 2024
204143
Myanmar
MMR
true
2
1
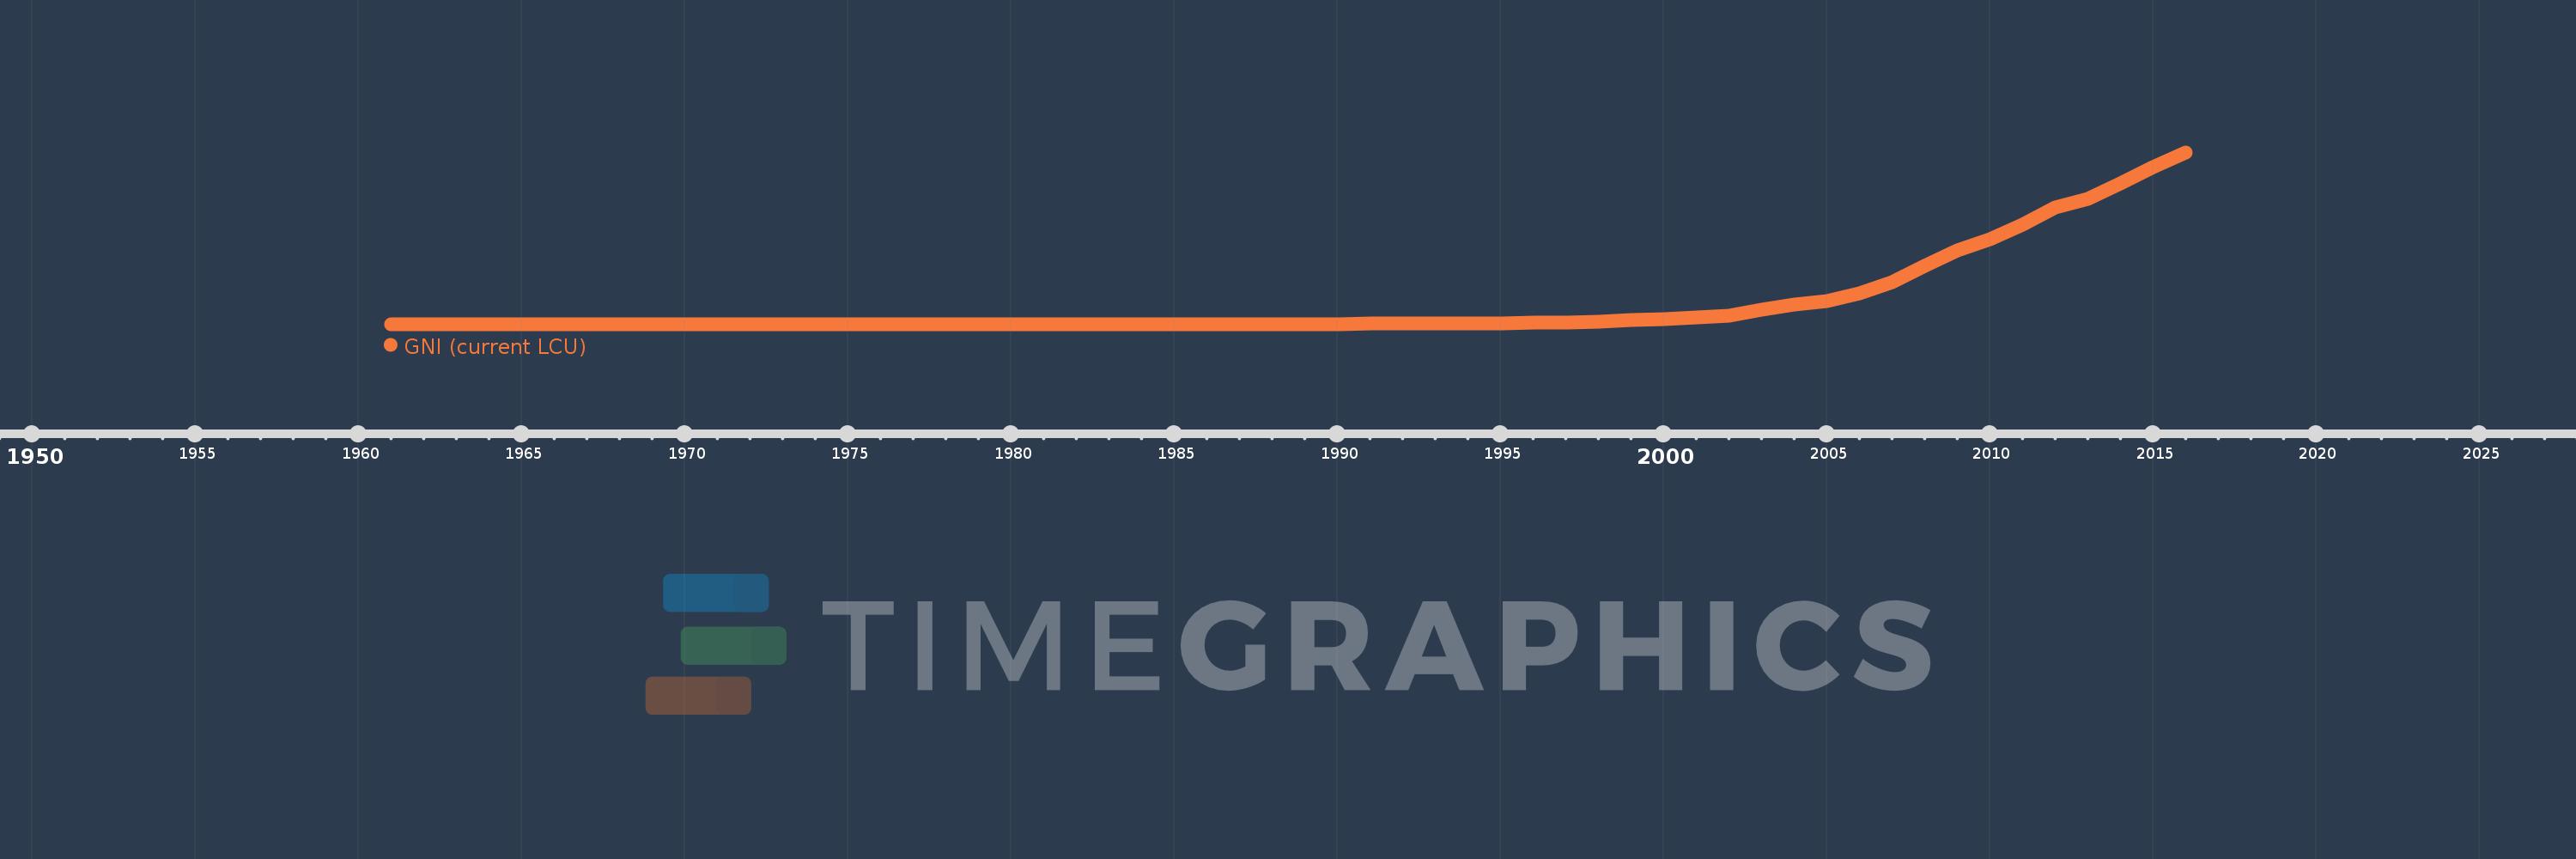
GNI (current LCU)
2016,2015,2014,2013,2012,2011,2010,2009,2008,2007,2006,2005,2004,2003,2002,2001,2000,1999,1998,1997,1996,1995,1994,1993,1992,1991,1990,1989,1988,1987,1986,1985,1984,1983,1982,1981,1980,1979,1978,1977,1976,1975,1974,1973,1972,1971,1970,1969,1968,1967,1966,1965,1964,1963,1962,1961
Estas estadísticas en otros países:
AfghanistanAlbaniaAlgeriaAmerican SamoaAndorraAngolaAntigua and BarbudaArgentinaArmeniaAustraliaAustriaAzerbaijanBahamas, TheBahrainBangladeshBarbadosBelarusBelgiumBelizeBeninBermudaBhutanBoliviaBosnia and HerzegovinaBotswanaBrazilBrunei DarussalamBulgariaBurkina FasoBurundiCabo VerdeCambodiaCameroonCanadaCentral African RepublicChadChannel IslandsChileChinaColombiaComorosCongo, Dem. Rep.Congo, Rep.Costa RicaCote d'IvoireCroatiaCubaCyprusCzech RepublicDenmarkDjiboutiDominicaDominican RepublicEcuadorEgypt, Arab Rep.El SalvadorEquatorial GuineaEritreaEstoniaEthiopiaFaroe IslandsFijiFinlandFranceFrench PolynesiaGabonGambia, TheGeorgiaGermanyGhanaGreeceGreenlandGrenadaGuamGuatemalaGuineaGuinea-BissauGuyanaHaitiHondurasHong Kong SAR, ChinaHungaryIcelandIndiaIndonesiaIran, Islamic Rep.IraqIrelandIsle of ManIsraelItalyJamaicaJapanJordanKazakhstanKenyaKiribatiKorea, Rep.KosovoKuwaitKyrgyz RepublicLao PDRLatviaLebanonLesothoLiberiaLibyaLiechtensteinLithuaniaLuxembourgMacao SAR, ChinaMacedonia, FYRMadagascarMalawiMalaysiaMaldivesMaliMaltaMarshall IslandsMauritaniaMauritiusMexicoMicronesia, Fed. Sts.MoldovaMonacoMongoliaMontenegroMoroccoMozambiqueMyanmarNamibiaNauruNepalNetherlandsNew CaledoniaNew ZealandNicaraguaNigerNigeriaNorwayOmanPakistanPalauPanamaPapua New GuineaParaguayPeruPhilippinesPolandPortugalPuerto RicoQatarRomaniaRussian FederationRwandaSamoaSan MarinoSao Tome and PrincipeSaudi ArabiaSenegalSerbiaSeychellesSierra LeoneSingaporeSlovak RepublicSloveniaSolomon IslandsSomaliaSouth AfricaSouth SudanSpainSri LankaSt. Kitts and NevisSt. LuciaSt. Vincent and the GrenadinesSudanSurinameSwazilandSwedenSwitzerlandSyrian Arab RepublicTajikistanTanzaniaThailandTimor-LesteTogoTongaTrinidad and TobagoTunisiaTurkeyTurkmenistanTuvaluUgandaUkraineUnited Arab EmiratesUnited KingdomUnited StatesUruguayUzbekistanVanuatuVenezuela, RBVietnamVirgin Islands (U.S.)West Bank and GazaYemen, Rep.ZambiaZimbabwe línea de tiempo (timeline):
En esta escala de tiempo se presenta un gráfico de 1961 y 2016 de Myanmar. Los datos de 1960 están ausentes. El número de observaciones reales por fecha: 56.
Fuente (nombre):
Indicadores del desarrollo mundial
Fuente (organización):
World Bank national accounts data, and OECD National Accounts data files.
Categorías:
Economy & Growth
Se ha actualizado:
23 abr 2017 año
Los indicadores de los cambios de valor en los últimos años
En promedio:
8.493 billones
Mínimo:
6.106 bn
1 ene 1961 año
Máximo:
68.361 billones
1 ene 2016 año
A la fecha de observación
Valor
Cambio absoluto
El cambio con respecto al valor anterior
1 ene 1961 año
6.106 bn
+6.106 bn
0.0%
1 ene 1962 año
6.225 bn
+118.994 millones
1.95%
1 ene 1963 año
6.531 bn
+305.962 millones
4.92%
1 ene 1964 año
7.473 bn
+942.002 millones
14.42%
1 ene 1965 año
6.789 bn
-684.056 millones
-9.15%
1 ene 1966 año
7.628 bn
+839.046 millones
12.36%
1 ene 1967 año
7.51 bn
-118.001 millones
-1.55%
1 ene 1968 año
8.203 bn
+693.002 millones
9.23%
1 ene 1969 año
9.35 bn
+1.147 bn
13.98%
1 ene 1970 año
9.926 bn
+576.0 millones
6.16%
1 ene 1971 año
10.262 bn
+335.999 millones
3.39%
1 ene 1972 año
10.427 bn
+165.0 millones
1.61%
1 ene 1973 año
10.748 bn
+321.0 millones
3.08%
1 ene 1974 año
11.719 bn
+971.0 millones
9.03%
1 ene 1975 año
19.307 bn
+7.588 bn
64.75%
1 ene 1976 año
23.47 bn
+4.163 bn
21.56%
1 ene 1977 año
27.409 bn
+3.939 bn
16.78%
1 ene 1978 año
29.557 bn
+2.148 bn
7.84%
1 ene 1979 año
31.708 bn
+2.151 bn
7.28%
1 ene 1980 año
35.187 bn
+3.479 bn
10.97%
1 ene 1981 año
38.447 bn
+3.26 bn
9.26%
1 ene 1982 año
42.711 bn
+4.264 bn
11.09%
1 ene 1983 año
46.464 bn
+3.753 bn
8.79%
1 ene 1984 año
49.313 bn
+2.849 bn
6.13%
1 ene 1985 año
53.08 bn
+3.767 bn
7.64%
1 ene 1986 año
55.408 bn
+2.328 bn
4.39%
1 ene 1987 año
58.369 bn
+2.961 bn
5.34%
1 ene 1988 año
68.178 bn
+9.809 bn
16.8%
1 ene 1989 año
75.982 bn
+7.804 bn
11.45%
1 ene 1990 año
124.067 bn
+48.085 bn
63.28%
1 ene 1991 año
151.988 bn
+27.921 bn
22.51%
1 ene 1992 año
186.511 bn
+34.523 bn
22.71%
1 ene 1993 año
249.242 bn
+62.73 bn
33.63%
1 ene 1994 año
359.892 bn
+110.65 bn
44.39%
1 ene 1995 año
472.378 bn
+112.486 bn
31.26%
1 ene 1996 año
604.04 bn
+131.662 bn
27.87%
1 ene 1997 año
791.864 bn
+187.824 bn
31.09%
1 ene 1998 año
1.119 billones
+327.576 bn
41.37%
1 ene 1999 año
1.61 billones
+490.37 bn
43.8%
1 ene 2000 año
2.19 billones
+580.433 bn
36.06%
1 ene 2001 año
2.552 billones
+361.63 bn
16.51%
1 ene 2002 año
3.545 billones
+993.162 bn
38.92%
1 ene 2003 año
5.621 billones
+2.076 billones
58.57%
1 ene 2004 año
7.712 billones
+2.091 billones
37.19%
1 ene 2005 año
9.075 billones
+1.363 billones
17.67%
1 ene 2006 año
12.279 billones
+3.204 billones
35.31%
1 ene 2007 año
16.846 billones
+4.567 billones
37.19%
1 ene 2008 año
23.329 billones
+6.484 billones
38.49%
1 ene 2009 año
29.224 billones
+5.895 billones
25.27%
1 ene 2010 año
33.884 billones
+4.66 billones
15.95%
1 ene 2011 año
39.767 billones
+5.883 billones
17.36%
1 ene 2012 año
46.298 billones
+6.531 billones
16.42%
1 ene 2013 año
49.752 billones
+3.454 billones
7.46%
1 ene 2014 año
56.167 billones
+6.415 billones
12.9%
1 ene 2015 año
62.552 billones
+6.385 billones
11.37%
1 ene 2016 año
68.361 billones
+5.809 billones
9.29%
Ranking de los países por los datos estadísticos actuales


Comentarios: