29
/es/
es
AIzaSyAYiBZKx7MnpbEhh9jyipgxe19OcubqV5w
April 1, 2024
203520
Mozambique
MOZ
true
2
1
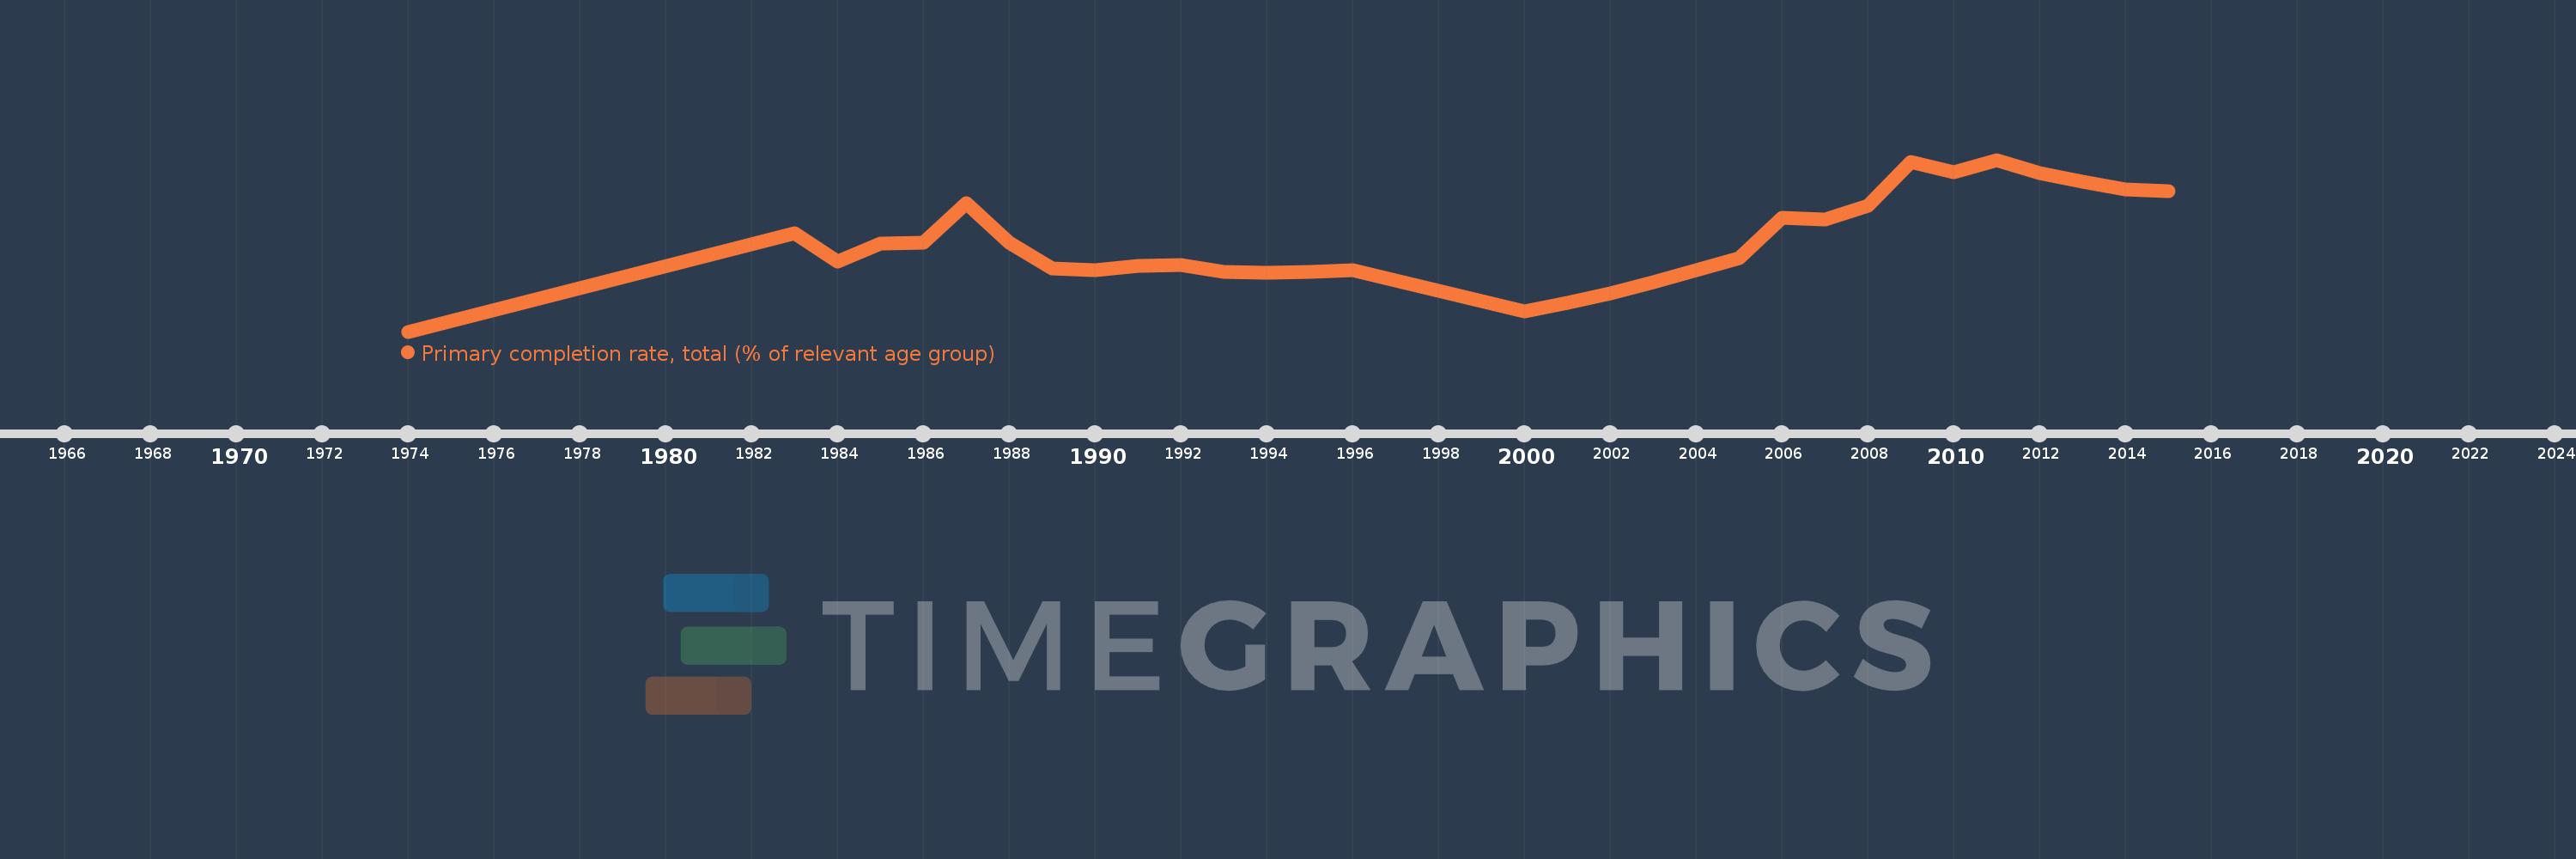
Primary completion rate, total (% of relevant age group)
2015,2014,2013,2012,2011,2010,2009,2008,2007,2006,2005,2003,2002,2001,2000,1996,1995,1994,1993,1992,1991,1990,1989,1988,1987,1986,1985,1984,1983,1974
Estas estadísticas en otros países:
AfghanistanAlbaniaAlgeriaAngolaAntigua and BarbudaArab WorldArgentinaArmeniaArubaAustriaAzerbaijanBahamas, TheBahrainBangladeshBarbadosBelarusBelgiumBelizeBeninBermudaBhutanBoliviaBosnia and HerzegovinaBotswanaBrazilBritish Virgin IslandsBrunei DarussalamBulgariaBurkina FasoBurundiCabo VerdeCambodiaCameroonCanadaCaribbean small statesCentral African RepublicCentral Europe and the BalticsChadChileChinaColombiaComorosCongo, Dem. Rep.Congo, Rep.Costa RicaCote d'IvoireCroatiaCubaCyprusCzech RepublicDenmarkDjiboutiDominicaDominican RepublicEarly-demographic dividendEast Asia & PacificEast Asia & Pacific (excluding high income)East Asia & Pacific (IDA & IBRD countries)EcuadorEgypt, Arab Rep.El SalvadorEquatorial GuineaEritreaEstoniaEthiopiaEuro areaEurope & Central AsiaEurope & Central Asia (excluding high income)Europe & Central Asia (IDA & IBRD countries)European UnionFijiFinlandFragile and conflict affected situationsFranceGabonGambia, TheGeorgiaGermanyGhanaGreeceGrenadaGuatemalaGuineaGuinea-BissauGuyanaHaitiHeavily indebted poor countries (HIPC)High incomeHondurasHong Kong SAR, ChinaHungaryIBRD onlyIcelandIDA & IBRD totalIDA blendIDA onlyIDA totalIndiaIndonesiaIran, Islamic Rep.IraqIrelandIsraelItalyJamaicaJapanJordanKazakhstanKenyaKiribatiKorea, Dem. People’s Rep.Korea, Rep.KuwaitKyrgyz RepublicLao PDRLate-demographic dividendLatin America & Caribbean Latin America & Caribbean (excluding high income)Latin America & the Caribbean (IDA & IBRD countries)LatviaLeast developed countries: UN classificationLebanonLesothoLiberiaLibyaLiechtensteinLithuaniaLow & middle incomeLow incomeLower middle incomeLuxembourgMacao SAR, ChinaMacedonia, FYRMadagascarMalawiMalaysiaMaldivesMaliMaltaMarshall IslandsMauritaniaMauritiusMexicoMiddle East & North AfricaMiddle East & North Africa (excluding high income)Middle East & North Africa (IDA & IBRD countries)Middle incomeMoldovaMongoliaMontenegroMoroccoMozambiqueMyanmarNamibiaNauruNepalNetherlandsNew ZealandNicaraguaNigerNigeriaNorwayOECD membersOmanOther small statesPacific island small statesPakistanPalauPanamaPapua New GuineaParaguayPeruPhilippinesPolandPortugalPost-demographic dividendPre-demographic dividendQatarRomaniaRussian FederationRwandaSamoaSan MarinoSao Tome and PrincipeSaudi ArabiaSenegalSerbiaSeychellesSierra LeoneSlovak RepublicSloveniaSmall statesSolomon IslandsSouth AfricaSouth AsiaSouth Asia (IDA & IBRD)South SudanSpainSri LankaSt. Kitts and NevisSt. LuciaSt. Vincent and the GrenadinesSub-Saharan Africa Sub-Saharan Africa (excluding high income)Sub-Saharan Africa (IDA & IBRD countries)SudanSurinameSwazilandSwedenSwitzerlandSyrian Arab RepublicTajikistanTanzaniaThailandTimor-LesteTogoTongaTrinidad and TobagoTunisiaTurkeyTuvaluUgandaUkraineUnited Arab EmiratesUpper middle incomeUruguayUzbekistanVanuatuVenezuela, RBVietnamWest Bank and GazaWorldYemen, Rep.ZambiaZimbabwe línea de tiempo (timeline):
En esta escala de tiempo se presenta un gráfico de 1974 y 2015 de Mozambique. Los datos de 1973 están ausentes. El número de observaciones reales por fecha: 30.
Fuente (nombre):
Indicadores del desarrollo mundial
Fuente (organización):
United Nations Educational, Scientific, and Cultural Organization (UNESCO) Institute for Statistics.
Categorías:
Aid Effectiveness, Climate Change, Education
Se ha actualizado:
23 abr 2017 año
Los indicadores de los cambios de valor en los últimos años
Mínimo:
8.351
1 ene 1974 año
Máximo:
56.337
1 ene 2011 año
A la fecha de observación
Valor
Cambio absoluto
El cambio con respecto al valor anterior
1 ene 1974 año
8.351
+8.351
0.0%
1 ene 1983 año
35.743
+27.393
328.04%
1 ene 1984 año
27.927
-7.816
-21.87%
1 ene 1985 año
32.966
+5.038
18.04%
1 ene 1986 año
33.111
+0.145
0.44%
1 ene 1987 año
44.121
+11.01
33.25%
1 ene 1988 año
33.136
-10.985
-24.9%
1 ene 1989 año
26.007
-7.129
-21.52%
1 ene 1990 año
25.555
-0.452
-1.74%
1 ene 1991 año
26.684
+1.13
4.42%
1 ene 1992 año
26.898
+0.214
0.8%
1 ene 1993 año
25.015
-1.883
-7.0%
1 ene 1994 año
24.731
-0.284
-1.14%
1 ene 1995 año
25.026
+0.294
1.19%
1 ene 1996 año
25.496
+0.471
1.88%
1 ene 2000 año
14.093
-11.403
-44.72%
1 ene 2001 año
16.272
+2.179
15.46%
1 ene 2002 año
18.962
+2.689
16.53%
1 ene 2003 año
22.174
+3.212
16.94%
1 ene 2005 año
28.815
+6.641
29.95%
1 ene 2006 año
40.24
+11.425
39.65%
1 ene 2007 año
39.589
-0.651
-1.62%
1 ene 2008 año
43.533
+3.943
9.96%
1 ene 2009 año
55.62
+12.087
27.77%
1 ene 2010 año
52.781
-2.838
-5.1%
1 ene 2011 año
56.337
+3.556
6.74%
1 ene 2012 año
52.649
-3.688
-6.55%
1 ene 2013 año
50.222
-2.427
-4.61%
1 ene 2014 año
48.035
-2.187
-4.35%
1 ene 2015 año
47.558
-0.477
-0.99%
Ranking de los países por los datos estadísticos actuales


Comentarios: