29
/es/
es
AIzaSyAYiBZKx7MnpbEhh9jyipgxe19OcubqV5w
April 1, 2024
201644
Morocco
MAR
true
2
1
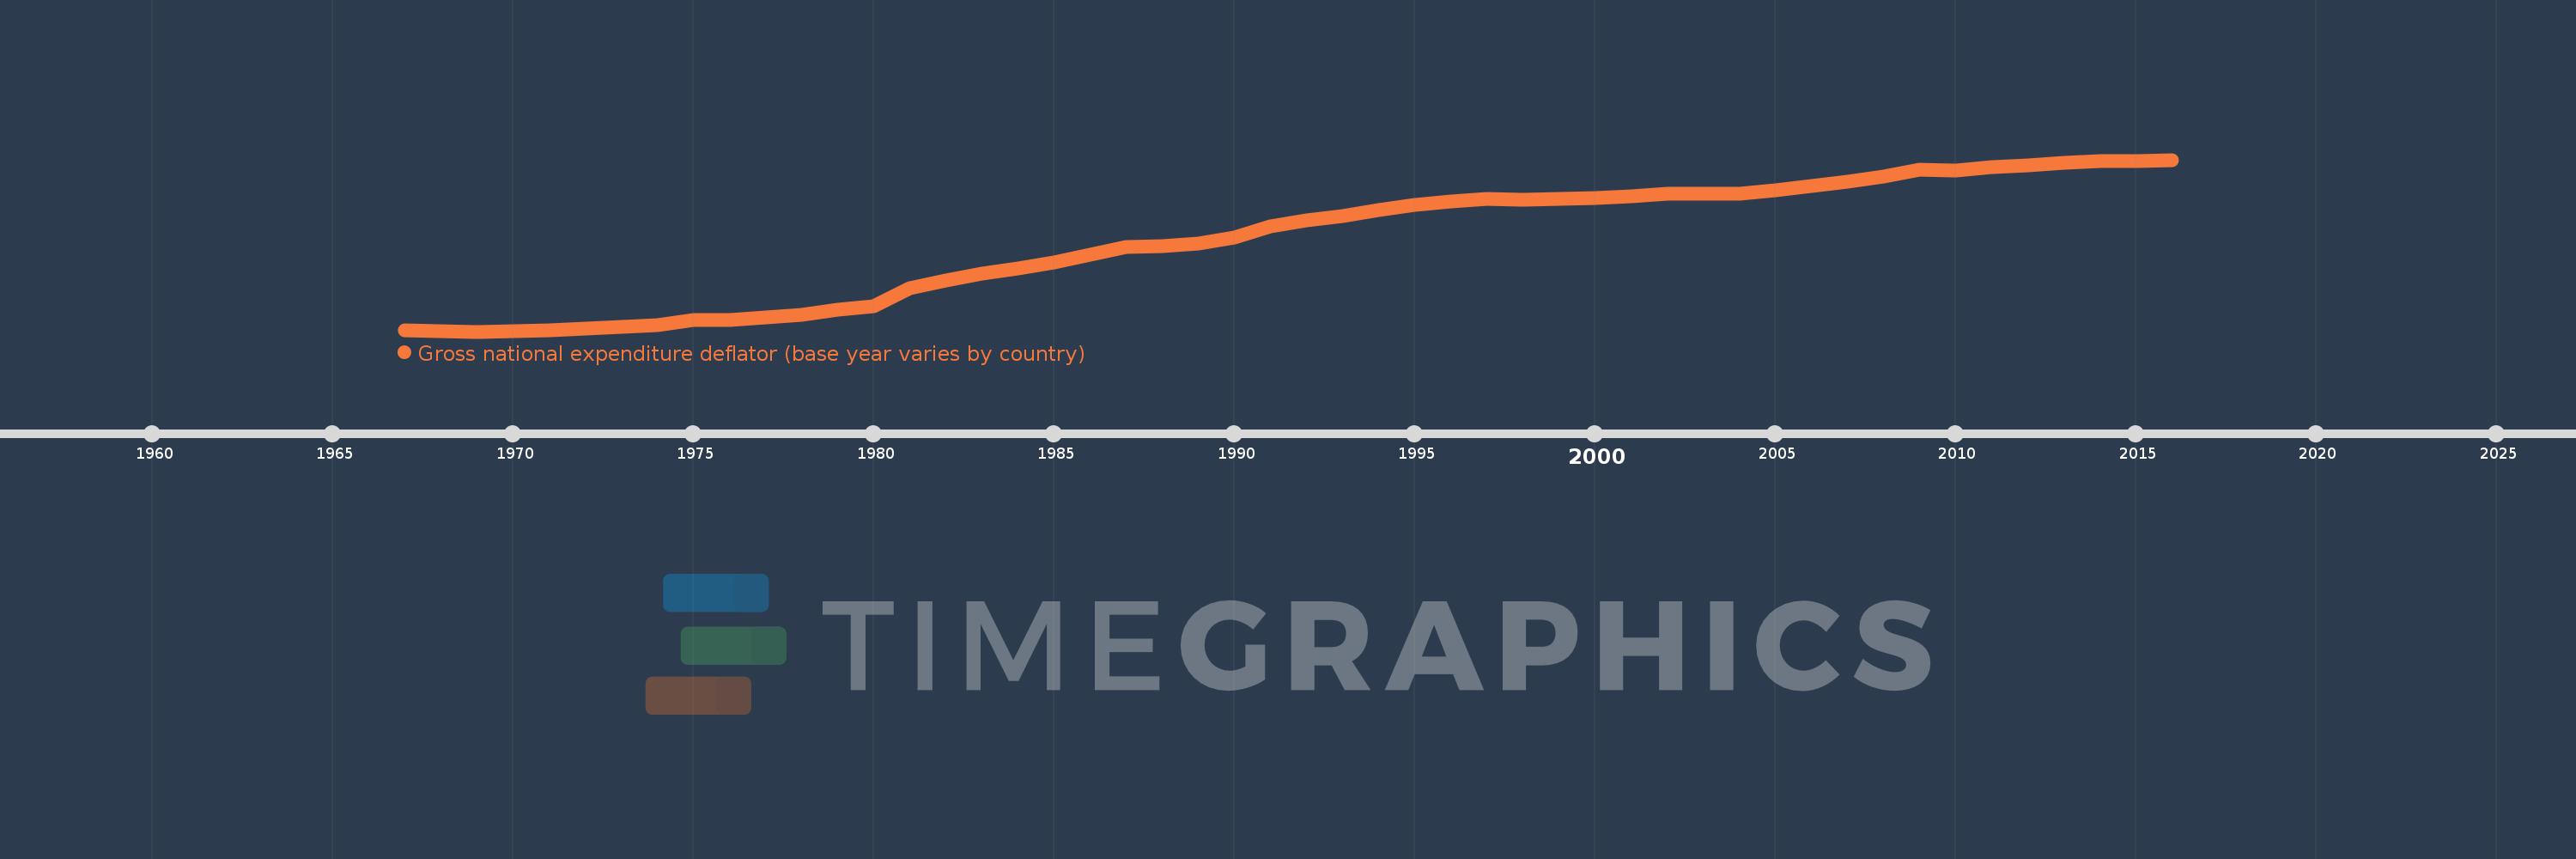
Gross national expenditure deflator (base year varies by country)
2016,2015,2014,2013,2012,2011,2010,2009,2008,2007,2006,2005,2004,2003,2002,2001,2000,1999,1998,1997,1996,1995,1994,1993,1992,1991,1990,1989,1988,1987,1986,1985,1984,1983,1982,1981,1980,1979,1978,1977,1976,1975,1974,1973,1972,1971,1970,1969,1968,1967
Estas estadísticas en otros países:
AlbaniaAlgeriaAngolaAntigua and BarbudaArgentinaArmeniaAustraliaAustriaAzerbaijanBahamas, TheBahrainBangladeshBarbadosBelarusBelgiumBelizeBeninBhutanBoliviaBosnia and HerzegovinaBotswanaBrazilBrunei DarussalamBulgariaBurkina FasoBurundiCabo VerdeCambodiaCameroonCanadaChadChileChinaColombiaComorosCongo, Dem. Rep.Congo, Rep.Costa RicaCote d'IvoireCroatiaCubaCyprusCzech RepublicDenmarkDjiboutiDominican RepublicEcuadorEgypt, Arab Rep.El SalvadorEquatorial GuineaEritreaEstoniaEthiopiaFijiFinlandFranceGabonGambia, TheGeorgiaGermanyGhanaGreeceGuatemalaGuineaGuinea-BissauHaitiHondurasHong Kong SAR, ChinaHungaryIcelandIndiaIndonesiaIran, Islamic Rep.IrelandIsraelItalyJamaicaJapanJordanKazakhstanKenyaKorea, Rep.KosovoKuwaitKyrgyz RepublicLao PDRLatviaLebanonLiberiaLibyaLithuaniaLuxembourgMacao SAR, ChinaMacedonia, FYRMadagascarMalawiMalaysiaMaliMaltaMauritaniaMauritiusMexicoMoldovaMongoliaMontenegroMoroccoMozambiqueMyanmarNamibiaNepalNetherlandsNew ZealandNicaraguaNigerNigeriaNorwayOmanPakistanPanamaPapua New GuineaParaguayPeruPhilippinesPolandPortugalPuerto RicoQatarRomaniaRussian FederationRwandaSamoaSaudi ArabiaSenegalSerbiaSeychellesSierra LeoneSingaporeSlovak RepublicSloveniaSomaliaSouth AfricaSouth SudanSpainSri LankaSudanSurinameSwazilandSwedenSwitzerlandSyrian Arab RepublicTajikistanTanzaniaThailandTimor-LesteTogoTrinidad and TobagoTunisiaTurkeyTurkmenistanUgandaUkraineUnited Arab EmiratesUnited KingdomUnited StatesUruguayUzbekistanVanuatuVenezuela, RBVietnamWest Bank and GazaZambiaZimbabwe línea de tiempo (timeline):
En esta escala de tiempo se presenta un gráfico de 1967 y 2016 de Morocco. Los datos de 1966 están ausentes. El número de observaciones reales por fecha: 50.
Fuente (nombre):
Indicadores del desarrollo mundial
Fuente (organización):
World Bank national accounts data, and OECD National Accounts data files.
Categorías:
Economy & Growth
Se ha actualizado:
23 abr 2017 año
Los indicadores de los cambios de valor en los últimos años
Mínimo:
14.737
1 ene 1969 año
Máximo:
109.044
1 ene 2016 año
A la fecha de observación
Valor
Cambio absoluto
El cambio con respecto al valor anterior
1 ene 1967 año
15.669
+15.669
0.0%
1 ene 1968 año
15.131
-0.538
-3.43%
1 ene 1969 año
14.737
-0.394
-2.61%
1 ene 1970 año
15.168
+0.431
2.92%
1 ene 1971 año
15.599
+0.431
2.84%
1 ene 1972 año
16.374
+0.775
4.97%
1 ene 1973 año
17.288
+0.914
5.58%
1 ene 1974 año
18.482
+1.194
6.91%
1 ene 1975 año
21.243
+2.761
14.94%
1 ene 1976 año
20.977
-0.266
-1.25%
1 ene 1977 año
22.56
+1.582
7.54%
1 ene 1978 año
24.017
+1.457
6.46%
1 ene 1979 año
26.815
+2.798
11.65%
1 ene 1980 año
28.541
+1.726
6.44%
1 ene 1981 año
38.392
+9.851
34.52%
1 ene 1982 año
42.888
+4.496
11.71%
1 ene 1983 año
46.485
+3.597
8.39%
1 ene 1984 año
49.169
+2.684
5.77%
1 ene 1985 año
52.91
+3.741
7.61%
1 ene 1986 año
57.144
+4.234
8.0%
1 ene 1987 año
61.062
+3.917
6.86%
1 ene 1988 año
61.462
+0.4
0.66%
1 ene 1989 año
63.257
+1.795
2.92%
1 ene 1990 año
66.172
+2.915
4.61%
1 ene 1991 año
72.38
+6.208
9.38%
1 ene 1992 año
75.637
+3.257
4.5%
1 ene 1993 año
78.146
+2.51
3.32%
1 ene 1994 año
81.582
+3.436
4.4%
1 ene 1995 año
84.316
+2.733
3.35%
1 ene 1996 año
86.351
+2.035
2.41%
1 ene 1997 año
87.701
+1.35
1.56%
1 ene 1998 año
87.134
-0.567
-0.65%
1 ene 1999 año
87.512
+0.378
0.43%
1 ene 2000 año
87.944
+0.433
0.49%
1 ene 2001 año
88.79
+0.845
0.96%
1 ene 2002 año
90.186
+1.397
1.57%
1 ene 2003 año
90.646
+0.46
0.51%
1 ene 2004 año
90.502
-0.144
-0.16%
1 ene 2005 año
92.348
+1.846
2.04%
1 ene 2006 año
94.62
+2.272
2.46%
1 ene 2007 año
96.966
+2.346
2.48%
1 ene 2008 año
100.0
+3.034
3.13%
1 ene 2009 año
103.458
+3.458
3.46%
1 ene 2010 año
102.978
-0.479
-0.46%
1 ene 2011 año
104.914
+1.936
1.88%
1 ene 2012 año
105.857
+0.943
0.9%
1 ene 2013 año
107.16
+1.302
1.23%
1 ene 2014 año
108.383
+1.224
1.14%
1 ene 2015 año
108.223
-0.16
-0.15%
1 ene 2016 año
109.044
+0.82
0.76%
Ranking de los países por los datos estadísticos actuales


Comentarios: