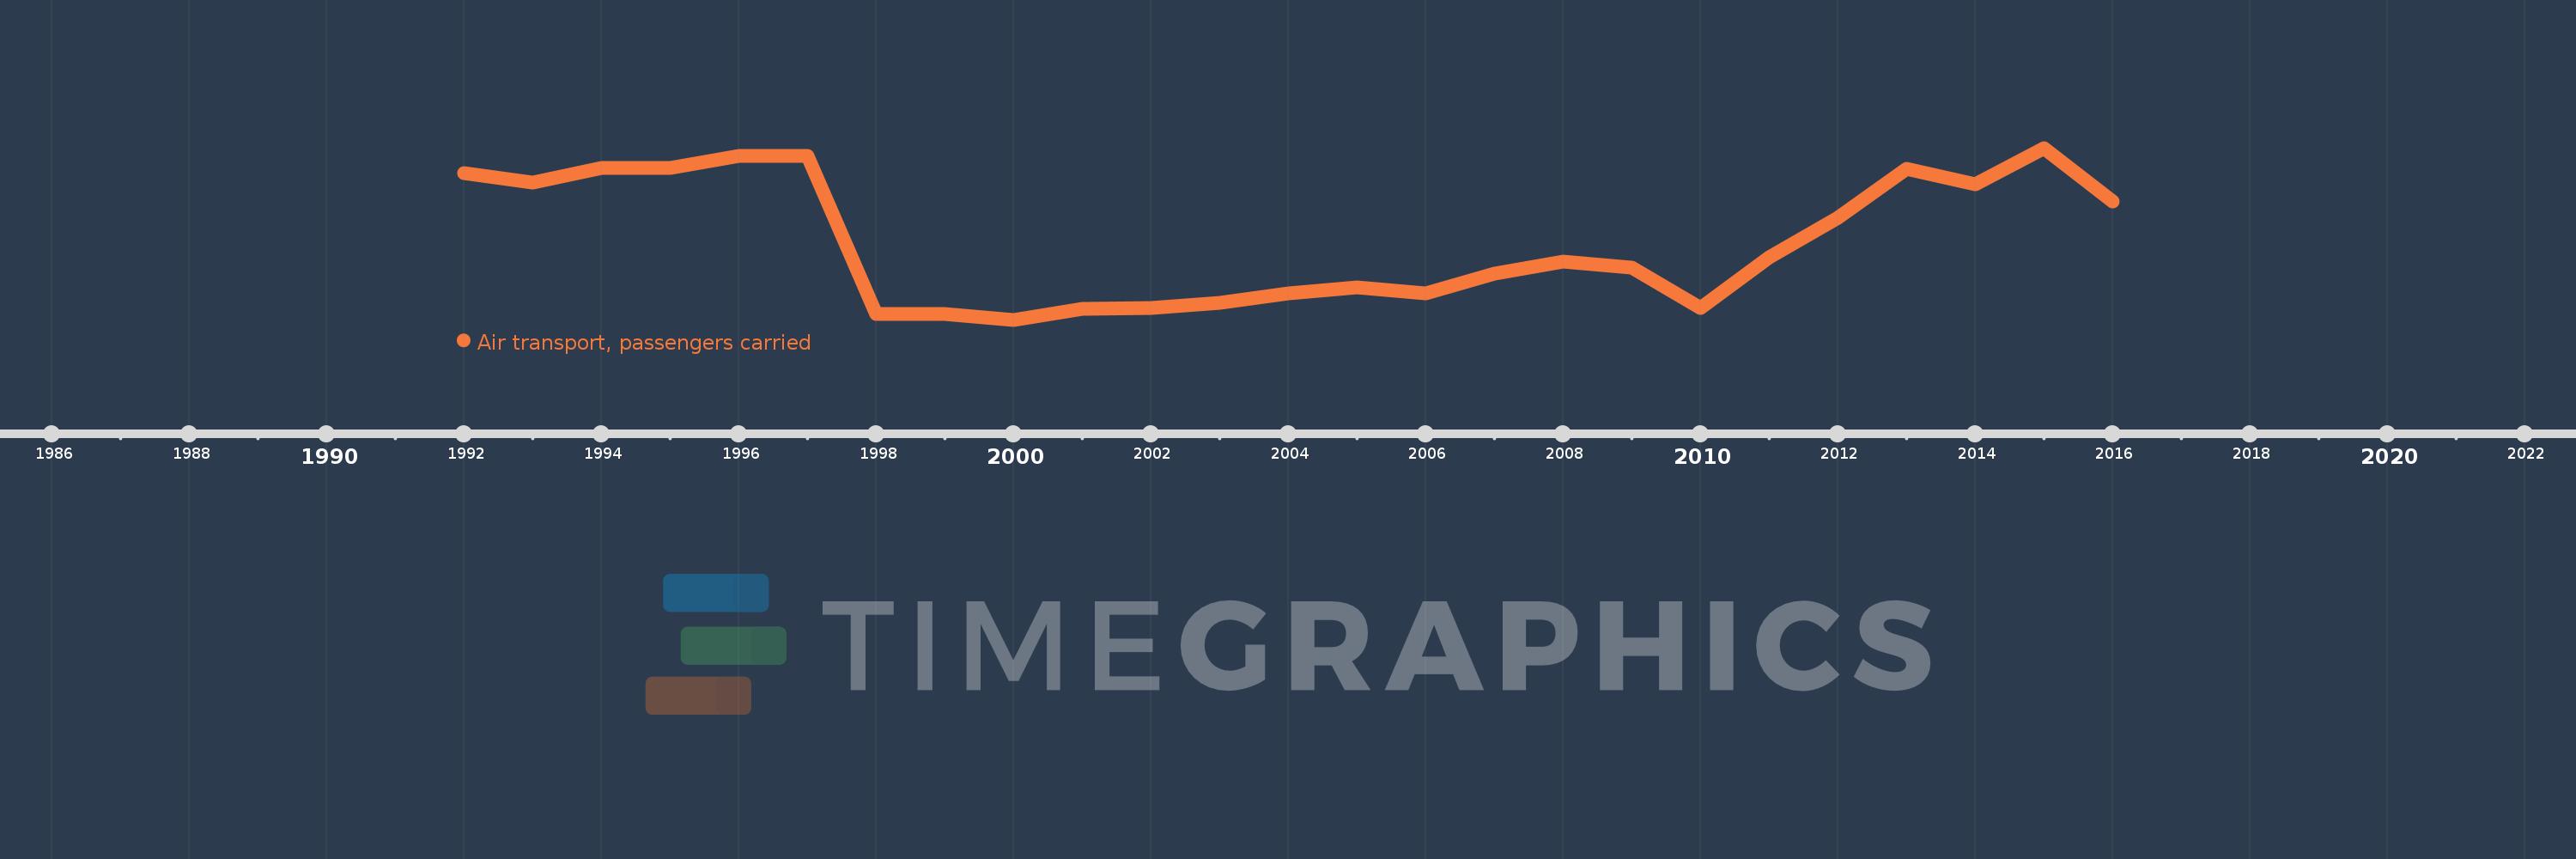
En esta escala de tiempo se presenta un gráfico de 1992 y 2016 de Mongolia. Los datos de 1991 están ausentes. El número de observaciones reales por fecha: 25.
Fuente (nombre):
Indicadores del desarrollo mundial
Fuente (organización):
International Civil Aviation Organization, Civil Aviation Statistics of the World and ICAO staff estimates.
Categorías:
Infrastructure
Se ha actualizado:
23 abr 2017 año
Los indicadores de los cambios de valor en los últimos años
En promedio:
433.93 mil
Mínimo:
224.7 mil
1 ene 2000 año
Máximo:
683.254 mil
1 ene 2015 año
A la fecha de observación
Valor
Cambio absoluto
El cambio con respecto al valor anterior
1 ene 1992 año
615.7 mil
+615.7 mil
0.0%
1 ene 1993 año
590.6 mil
-25.1 mil
-4.08%
1 ene 1994 año
630.0 mil
+39.4 mil
6.67%
1 ene 1995 año
630.0 mil
0.0
0.0%
1 ene 1996 año
661.5 mil
+31.5 mil
5.0%
1 ene 1997 año
661.5 mil
0.0
0.0%
1 ene 1998 año
240.2 mil
-421.3 mil
-63.69%
1 ene 1999 año
239.7 mil
-500.0
-0.21%
1 ene 2000 año
224.7 mil
-15.0 mil
-6.26%
1 ene 2001 año
253.917 mil
+29.217 mil
13.0%
1 ene 2002 año
255.298 mil
+1.381 mil
0.54%
1 ene 2003 año
269.886 mil
+14.588 mil
5.71%
1 ene 2004 año
294.88 mil
+24.994 mil
9.26%
1 ene 2005 año
310.158 mil
+15.278 mil
5.18%
1 ene 2006 año
295.252 mil
-14.906 mil
-4.81%
1 ene 2007 año
347.998 mil
+52.746 mil
17.86%
1 ene 2008 año
380.708 mil
+32.71 mil
9.4%
1 ene 2009 año
364.47 mil
-16.238 mil
-4.27%
1 ene 2010 año
257.233 mil
-107.237 mil
-29.42%
1 ene 2011 año
391.188 mil
+133.955 mil
52.08%
1 ene 2012 año
496.649 mil
+105.461 mil
26.96%
1 ene 2013 año
626.47 mil
+129.821 mil
26.14%
1 ene 2014 año
585.864 mil
-40.606 mil
-6.48%
1 ene 2015 año
683.254 mil
+97.39 mil
16.62%
1 ene 2016 año
541.129 mil
-142.125 mil
-20.8%
Ranking de los países por los datos estadísticos actuales
