29
/es/
es
AIzaSyAYiBZKx7MnpbEhh9jyipgxe19OcubqV5w
April 1, 2024
195530
Mexico
MEX
true
2
1
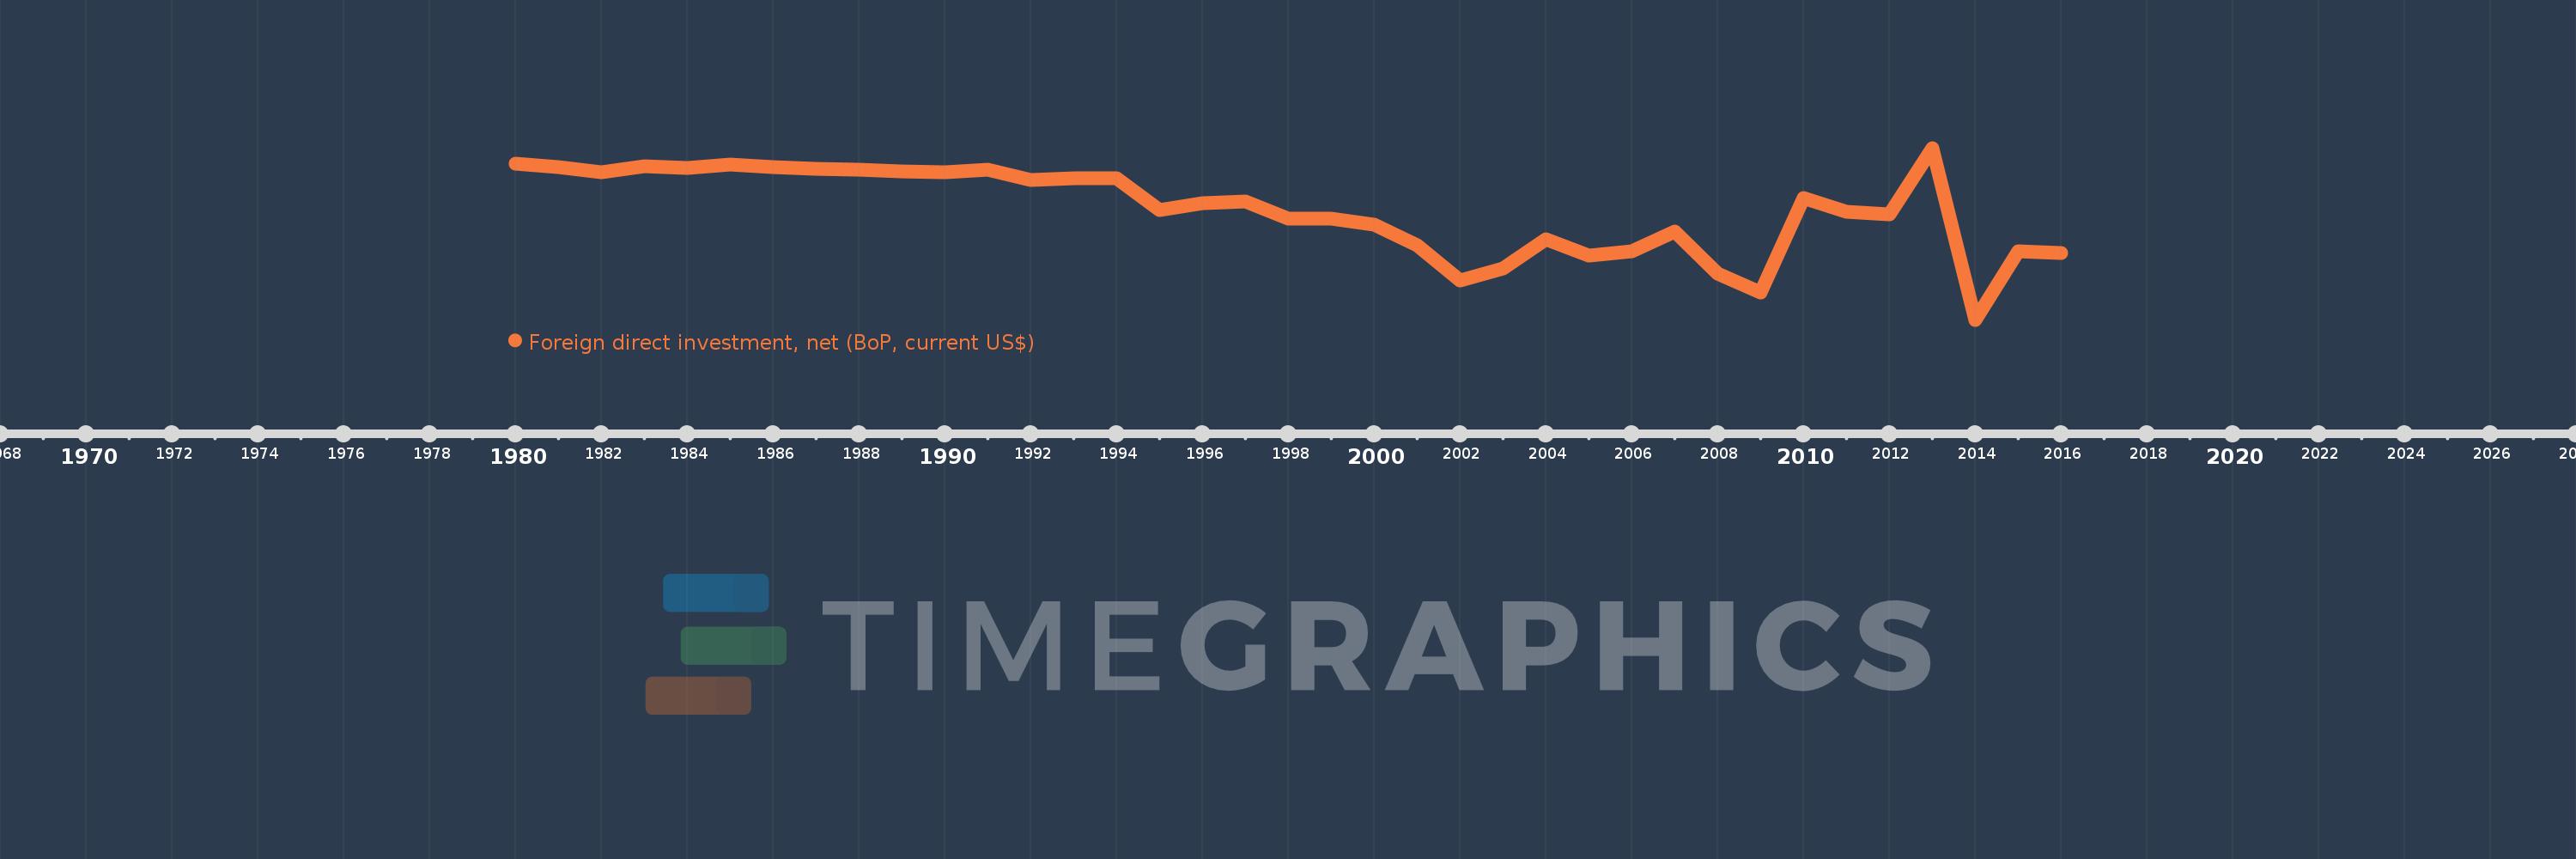
Foreign direct investment, net (BoP, current US$)
2016,2015,2014,2013,2012,2011,2010,2009,2008,2007,2006,2005,2004,2003,2002,2001,2000,1999,1998,1997,1996,1995,1994,1993,1992,1991,1990,1989,1988,1987,1986,1985,1984,1983,1982,1981,1980
Estas estadísticas en otros países:
AfghanistanAlbaniaAlgeriaAngolaAntigua and BarbudaArgentinaArmeniaArubaAustraliaAustriaAzerbaijanBahamas, TheBahrainBangladeshBarbadosBelarusBelgiumBelizeBeninBermudaBhutanBoliviaBosnia and HerzegovinaBotswanaBrazilBrunei DarussalamBulgariaBurkina FasoBurundiCabo VerdeCambodiaCameroonCanadaCentral African RepublicChadChileChinaColombiaComorosCongo, Dem. Rep.Congo, Rep.Costa RicaCote d'IvoireCroatiaCuracaoCyprusCzech RepublicDenmarkDjiboutiDominicaDominican RepublicEcuadorEgypt, Arab Rep.El SalvadorEquatorial GuineaEritreaEstoniaEthiopiaEuro areaFijiFinlandFranceFrench PolynesiaGabonGambia, TheGeorgiaGermanyGhanaGreeceGrenadaGuatemalaGuineaGuinea-BissauGuyanaHaitiHondurasHong Kong SAR, ChinaHungaryIcelandIndiaIndonesiaIran, Islamic Rep.IraqIrelandIsraelItalyJamaicaJapanJordanKazakhstanKenyaKiribatiKorea, Rep.KosovoKuwaitKyrgyz RepublicLao PDRLatviaLebanonLesothoLiberiaLibyaLithuaniaLuxembourgMacao SAR, ChinaMacedonia, FYRMadagascarMalawiMalaysiaMaldivesMaliMaltaMarshall IslandsMauritaniaMauritiusMexicoMicronesia, Fed. Sts.MoldovaMongoliaMontenegroMoroccoMozambiqueMyanmarNamibiaNepalNetherlandsNew CaledoniaNew ZealandNicaraguaNigerNigeriaNorwayOmanPakistanPalauPanamaPapua New GuineaParaguayPeruPhilippinesPolandPortugalQatarRomaniaRussian FederationRwandaSamoaSao Tome and PrincipeSaudi ArabiaSenegalSerbiaSeychellesSierra LeoneSingaporeSint Maarten (Dutch part)Slovak RepublicSloveniaSolomon IslandsSouth AfricaSouth SudanSpainSri LankaSt. Kitts and NevisSt. LuciaSt. Vincent and the GrenadinesSudanSurinameSwazilandSwedenSwitzerlandSyrian Arab RepublicTajikistanTanzaniaThailandTimor-LesteTogoTongaTrinidad and TobagoTunisiaTurkeyTuvaluUgandaUkraineUnited KingdomUnited StatesUruguayVanuatuVenezuela, RBVietnamWest Bank and GazaYemen, Rep.ZambiaZimbabwe línea de tiempo (timeline):
En esta escala de tiempo se presenta un gráfico de 1980 y 2016 de Mexico. Los datos de 1979 están ausentes. El número de observaciones reales por fecha: 37.
Fuente (nombre):
Indicadores del desarrollo mundial
Fuente (organización):
International Monetary Fund, Balance of Payments Statistics Yearbook and data files.
Categorías:
Economy & Growth, Financial Sector
Se ha actualizado:
23 abr 2017 año
Los indicadores de los cambios de valor en los últimos años
Mínimo:
-33.764 bn
1 ene 2014 año
Máximo:
1.922 bn
1 ene 2013 año
A la fecha de observación
Valor
Cambio absoluto
El cambio con respecto al valor anterior
1 ene 1980 año
-1.332 bn
-1.332 bn
0.0%
1 ene 1981 año
-2.09 bn
-758.0 millones
56.91%
1 ene 1982 año
-3.078 bn
-988.0 millones
47.27%
1 ene 1983 año
-1.901 bn
+1.177 bn
-38.24%
1 ene 1984 año
-2.192 bn
-291.0 millones
15.31%
1 ene 1985 año
-1.542 bn
+650.0 millones
-29.65%
1 ene 1986 año
-1.984 bn
-442.0 millones
28.66%
1 ene 1987 año
-2.4 bn
-416.0 millones
20.97%
1 ene 1988 año
-2.634 bn
-234.0 millones
9.75%
1 ene 1989 año
-2.879 bn
-245.0 millones
9.3%
1 ene 1990 año
-3.174 bn
-295.0 millones
10.25%
1 ene 1991 año
-2.634 bn
+540.0 millones
-17.01%
1 ene 1992 año
-4.762 bn
-2.128 bn
80.79%
1 ene 1993 año
-4.393 bn
+369.0 millones
-7.75%
1 ene 1994 año
-4.389 bn
+4.0 millones
-0.09%
1 ene 1995 año
-10.973 bn
-6.583 bn
150.0%
1 ene 1996 año
-9.526 bn
+1.446 bn
-13.18%
1 ene 1997 año
-9.186 bn
+340.69 millones
-3.58%
1 ene 1998 año
-12.83 bn
-3.644 bn
39.67%
1 ene 1999 año
-12.757 bn
+73.035 millones
-0.57%
1 ene 2000 año
-13.941 bn
-1.184 bn
9.28%
1 ene 2001 año
-18.381 bn
-4.44 bn
31.85%
1 ene 2002 año
-25.655 bn
-7.274 bn
39.57%
1 ene 2003 año
-23.161 bn
+2.494 bn
-9.72%
1 ene 2004 año
-16.969 bn
+6.192 bn
-26.73%
1 ene 2005 año
-20.483 bn
-3.514 bn
20.71%
1 ene 2006 año
-19.498 bn
+985.446 millones
-4.81%
1 ene 2007 año
-15.374 bn
+4.124 bn
-21.15%
1 ene 2008 año
-24.163 bn
-8.789 bn
57.17%
1 ene 2009 año
-28.195 bn
-4.032 bn
16.69%
1 ene 2010 año
-8.45 bn
+19.745 bn
-70.03%
1 ene 2011 año
-11.405 bn
-2.955 bn
34.97%
1 ene 2012 año
-11.916 bn
-510.783 millones
4.48%
1 ene 2013 año
1.922 bn
+13.838 bn
-116.13%
1 ene 2014 año
-33.764 bn
-35.686 bn
-1.86 mil%
1 ene 2015 año
-19.485 bn
+14.279 bn
-42.29%
1 ene 2016 año
-19.93 bn
-445.202 millones
2.28%
Ranking de los países por los datos estadísticos actuales


Comentarios: