29
/es/
es
AIzaSyAYiBZKx7MnpbEhh9jyipgxe19OcubqV5w
April 1, 2024
194565
Mauritius
MUS
true
2
1
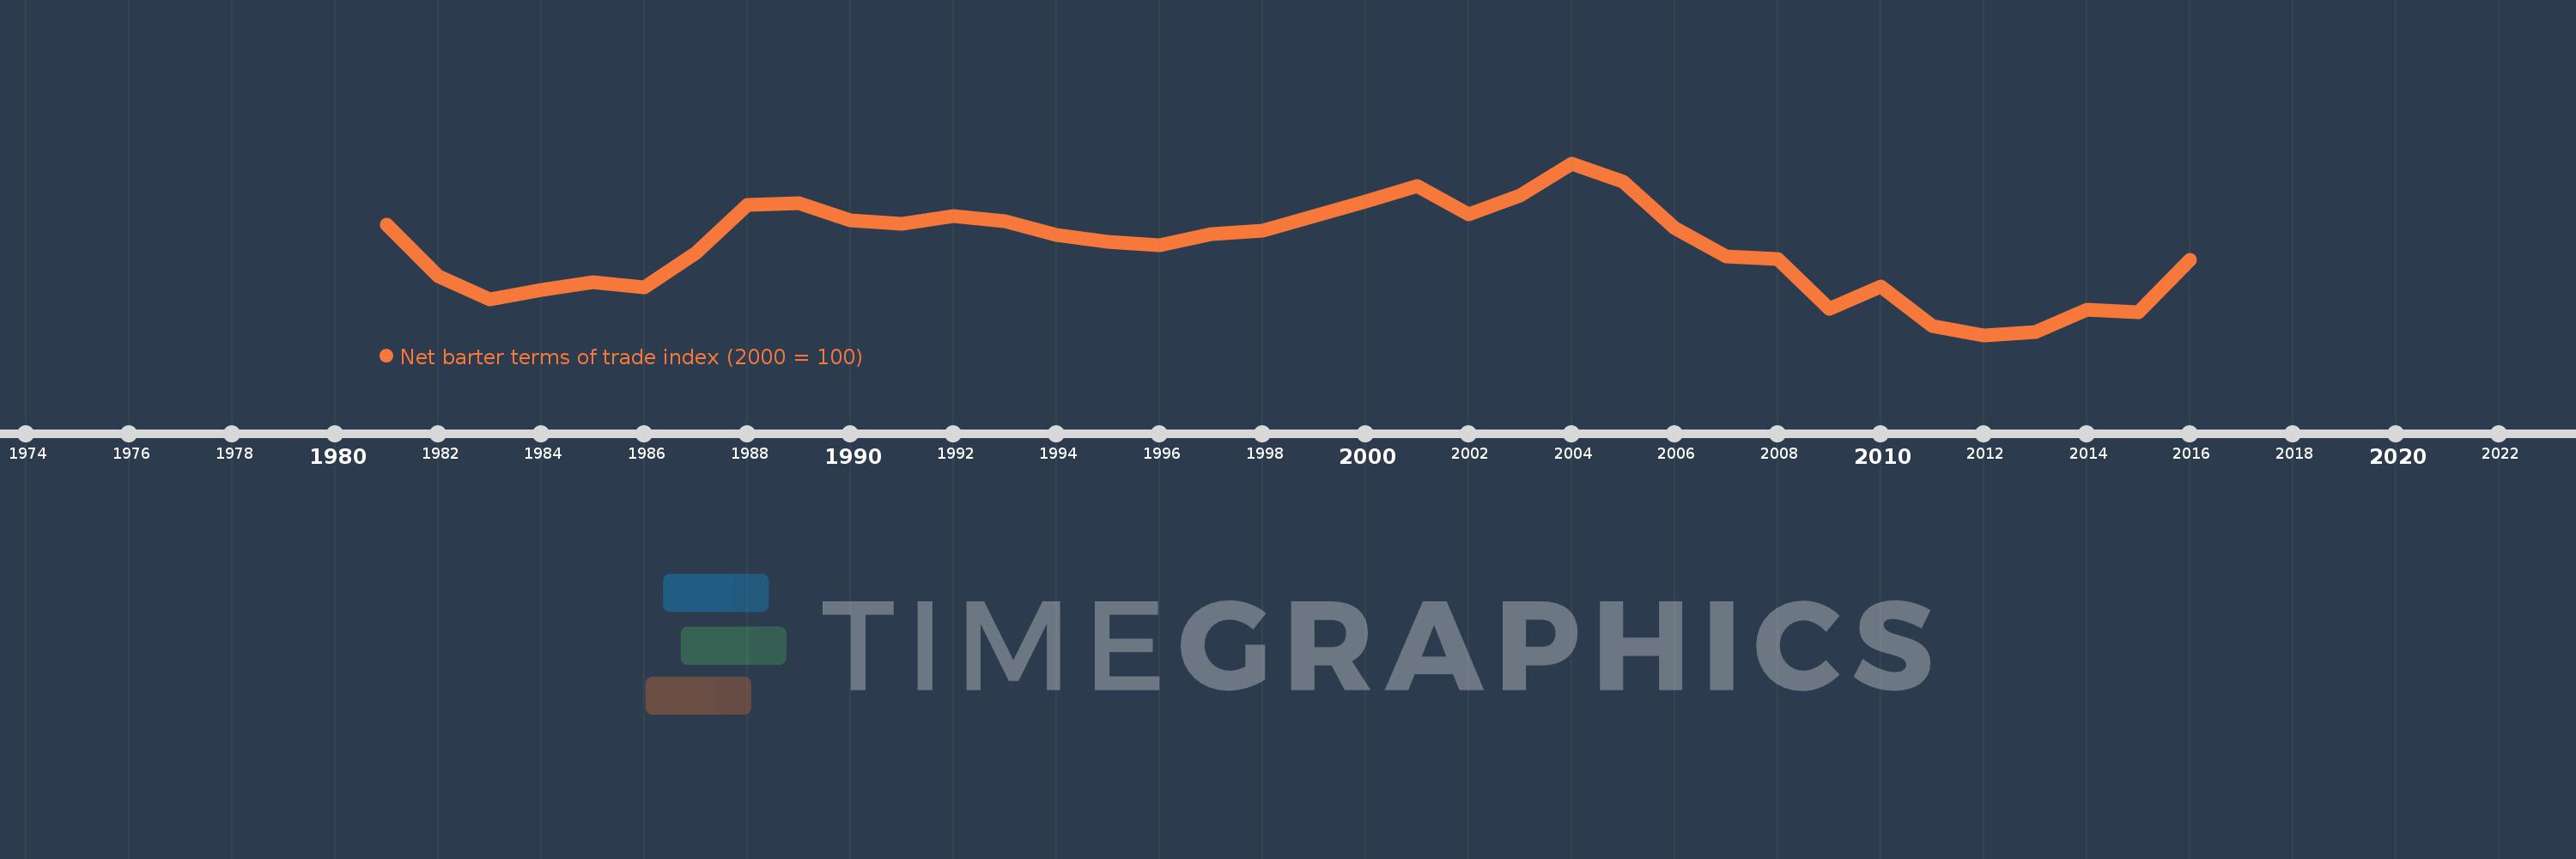
Net barter terms of trade index (2000 = 100)
2016,2015,2014,2013,2012,2011,2010,2009,2008,2007,2006,2005,2004,2003,2002,2001,2000,1999,1998,1997,1996,1995,1994,1993,1992,1991,1990,1989,1988,1987,1986,1985,1984,1983,1982,1981
Estas estadísticas en otros países:
AfghanistanAlbaniaAlgeriaAmerican SamoaAndorraAngolaAntigua and BarbudaArgentinaArmeniaArubaAustraliaAustriaAzerbaijanBahamas, TheBahrainBangladeshBarbadosBelarusBelgiumBelizeBeninBermudaBhutanBoliviaBosnia and HerzegovinaBotswanaBrazilBritish Virgin IslandsBrunei DarussalamBulgariaBurkina FasoBurundiCabo VerdeCambodiaCameroonCanadaCayman IslandsCentral African RepublicChadChileChinaColombiaComorosCongo, Dem. Rep.Congo, Rep.Costa RicaCote d'IvoireCroatiaCubaCuracaoCyprusCzech RepublicDenmarkDjiboutiDominicaDominican RepublicEcuadorEgypt, Arab Rep.El SalvadorEquatorial GuineaEritreaEstoniaEthiopiaFaroe IslandsFijiFinlandFranceFrench PolynesiaGabonGambia, TheGeorgiaGermanyGhanaGibraltarGreeceGreenlandGrenadaGuamGuatemalaGuineaGuinea-BissauGuyanaHaitiHondurasHong Kong SAR, ChinaHungaryIcelandIndiaIndonesiaIran, Islamic Rep.IraqIrelandIsraelItalyJamaicaJapanJordanKazakhstanKenyaKiribatiKorea, Dem. People’s Rep.Korea, Rep.KuwaitKyrgyz RepublicLao PDRLatviaLebanonLesothoLiberiaLibyaLithuaniaLuxembourgMacao SAR, ChinaMacedonia, FYRMadagascarMalawiMalaysiaMaldivesMaliMaltaMarshall IslandsMauritaniaMauritiusMexicoMicronesia, Fed. Sts.MoldovaMongoliaMoroccoMozambiqueMyanmarNamibiaNauruNepalNetherlandsNew CaledoniaNew ZealandNicaraguaNigerNigeriaNorthern Mariana IslandsNorwayOmanPakistanPalauPanamaPapua New GuineaParaguayPeruPhilippinesPolandPortugalQatarRomaniaRussian FederationRwandaSamoaSao Tome and PrincipeSaudi ArabiaSenegalSerbiaSeychellesSierra LeoneSingaporeSlovak RepublicSloveniaSolomon IslandsSomaliaSouth AfricaSpainSri LankaSt. Kitts and NevisSt. LuciaSt. Vincent and the GrenadinesSudanSurinameSwazilandSwedenSwitzerlandSyrian Arab RepublicTajikistanTanzaniaThailandTogoTongaTrinidad and TobagoTunisiaTurkeyTurkmenistanTurks and Caicos IslandsUgandaUkraineUnited Arab EmiratesUnited KingdomUnited StatesUruguayUzbekistanVanuatuVenezuela, RBVietnamWest Bank and GazaYemen, Rep.ZambiaZimbabwe línea de tiempo (timeline):
En esta escala de tiempo se presenta un gráfico de 1981 y 2016 de Mauritius. Los datos de 1980 están ausentes. El número de observaciones reales por fecha: 36.
Fuente (nombre):
Indicadores del desarrollo mundial
Fuente (organización):
United Nations Conference on Trade and Development, Handbook of Statistics and data files, and International Monetary Fund, International Financial Statistics.
Categorías:
Private Sector, Trade
Se ha actualizado:
23 abr 2017 año
Los indicadores de los cambios de valor en los últimos años
Mínimo:
71.047
1 ene 2012 año
Máximo:
104.444
1 ene 2004 año
A la fecha de observación
Valor
Cambio absoluto
El cambio con respecto al valor anterior
1 ene 1981 año
92.5
+92.5
0.0%
1 ene 1982 año
82.418
-10.082
-10.9%
1 ene 1983 año
78.049
-4.369
-5.3%
1 ene 1984 año
79.747
+1.698
2.18%
1 ene 1985 año
81.333
+1.586
1.99%
1 ene 1986 año
80.282
-1.052
-1.29%
1 ene 1987 año
87.013
+6.731
8.38%
1 ene 1988 año
96.386
+9.373
10.77%
1 ene 1989 año
96.629
+0.244
0.25%
1 ene 1990 año
93.333
-3.296
-3.41%
1 ene 1991 año
92.632
-0.702
-0.75%
1 ene 1992 año
94.175
+1.543
1.67%
1 ene 1993 año
93.137
-1.038
-1.1%
1 ene 1994 año
90.566
-2.571
-2.76%
1 ene 1995 año
89.216
-1.35
-1.49%
1 ene 1996 año
88.496
-0.72
-0.81%
1 ene 1997 año
90.678
+2.182
2.47%
1 ene 1998 año
91.379
+0.701
0.77%
1 ene 1999 año
94.175
+2.795
3.06%
1 ene 2000 año
96.939
+2.764
2.93%
1 ene 2001 año
100.0
+3.061
3.16%
1 ene 2002 año
94.522
-5.478
-5.48%
1 ene 2003 año
98.138
+3.616
3.83%
1 ene 2004 año
104.444
+6.306
6.43%
1 ene 2005 año
100.842
-3.602
-3.45%
1 ene 2006 año
91.916
-8.926
-8.85%
1 ene 2007 año
86.371
-5.545
-6.03%
1 ene 2008 año
85.881
-0.49
-0.57%
1 ene 2009 año
76.185
-9.696
-11.29%
1 ene 2010 año
80.518
+4.333
5.69%
1 ene 2011 año
72.767
-7.751
-9.63%
1 ene 2012 año
71.047
-1.719
-2.36%
1 ene 2013 año
71.664
+0.617
0.87%
1 ene 2014 año
75.998
+4.333
6.05%
1 ene 2015 año
75.497
-0.501
-0.66%
1 ene 2016 año
85.649
+10.152
13.45%
Ranking de los países por los datos estadísticos actuales


Comentarios: