29
/es/
es
AIzaSyAYiBZKx7MnpbEhh9jyipgxe19OcubqV5w
April 1, 2024
192103
Marshall Islands
MHL
true
2
1
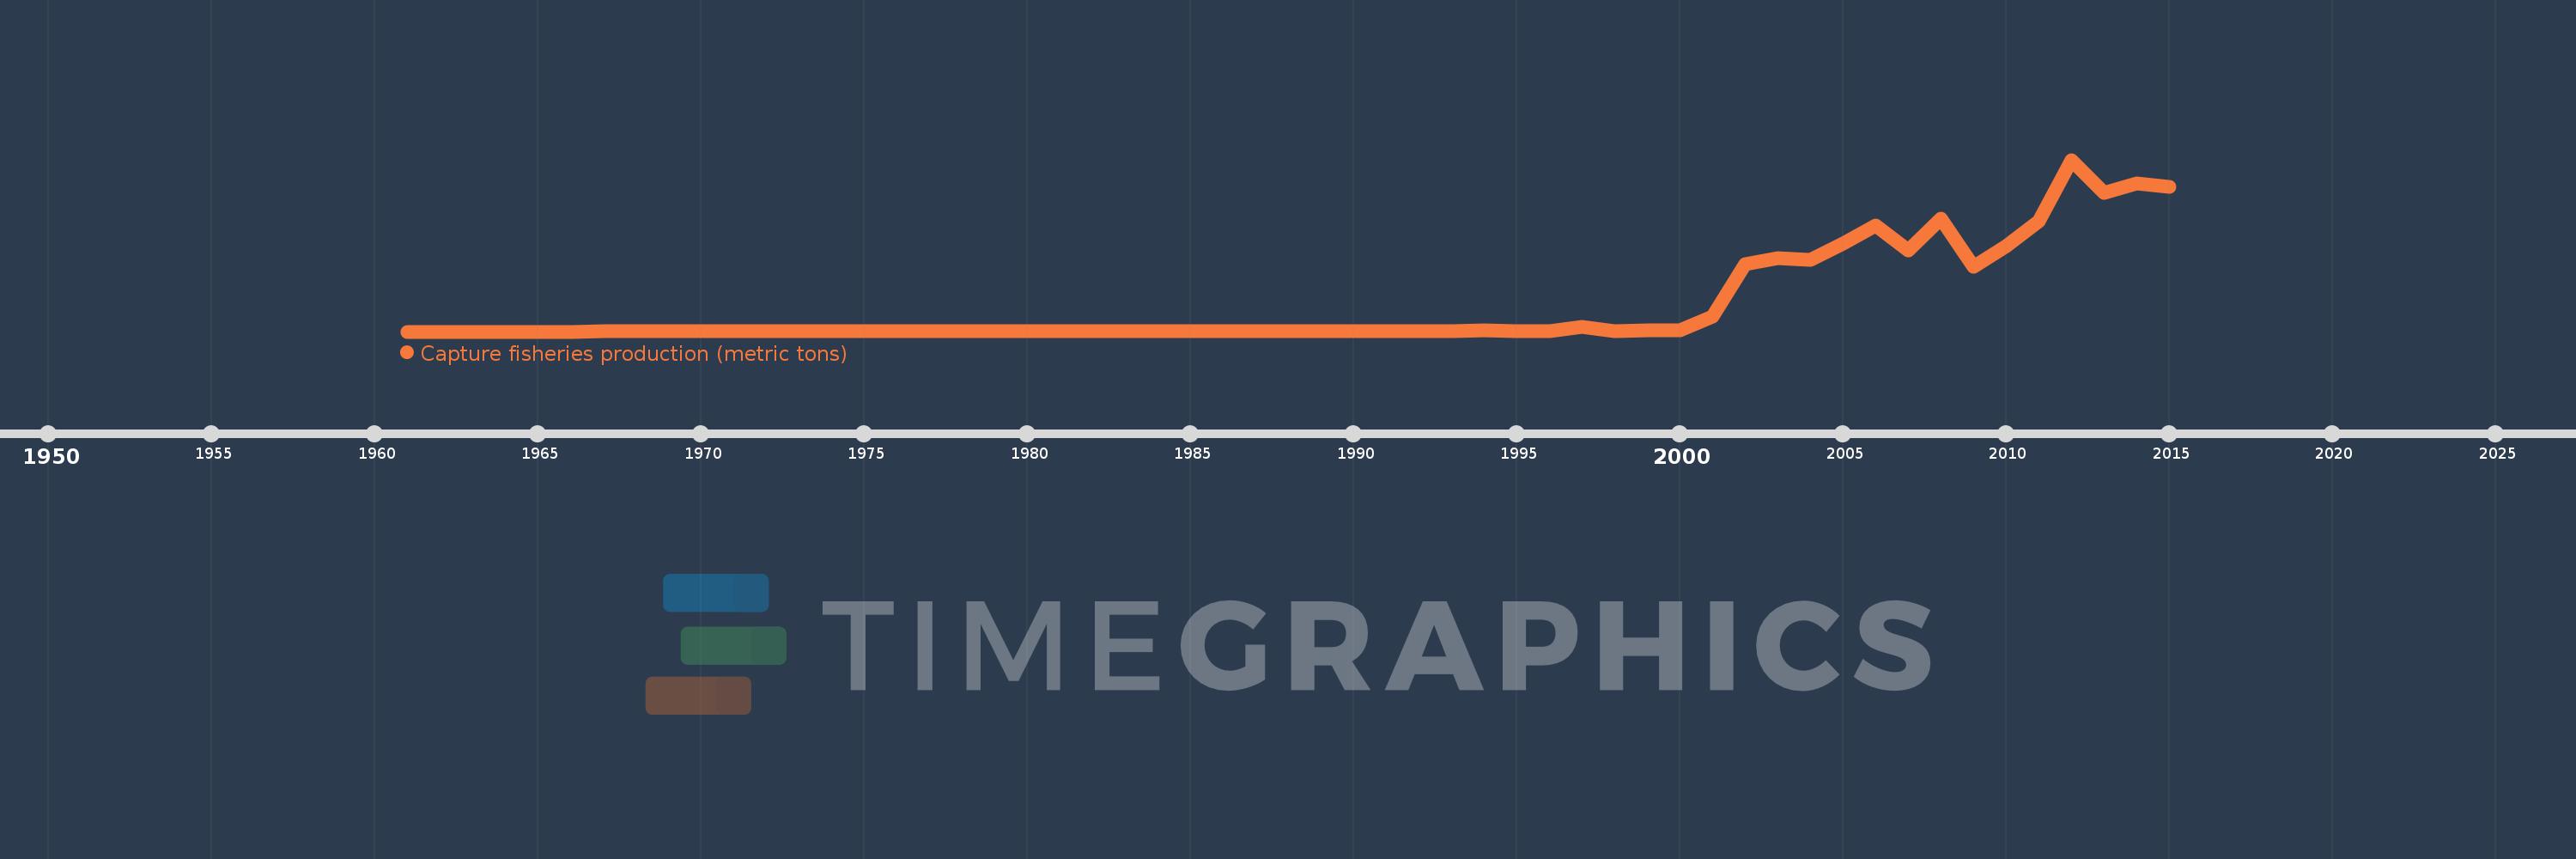
Capture fisheries production (metric tons)
2015,2014,2013,2012,2011,2010,2009,2008,2007,2006,2005,2004,2003,2002,2001,2000,1999,1998,1997,1996,1995,1994,1993,1992,1991,1990,1989,1988,1987,1986,1985,1984,1983,1982,1981,1980,1979,1978,1977,1976,1975,1974,1973,1972,1971,1970,1969,1968,1967,1966,1965,1964,1963,1962,1961
Estas estadísticas en otros países:
AfghanistanAlbaniaAlgeriaAmerican SamoaAngolaAntigua and BarbudaArab WorldArgentinaArmeniaArubaAustraliaAustriaAzerbaijanBahamas, TheBahrainBangladeshBarbadosBelarusBelgiumBelizeBeninBermudaBhutanBoliviaBosnia and HerzegovinaBotswanaBrazilBritish Virgin IslandsBrunei DarussalamBulgariaBurkina FasoBurundiCabo VerdeCambodiaCameroonCanadaCaribbean small statesCayman IslandsCentral African RepublicCentral Europe and the BalticsChadChannel IslandsChileChinaColombiaComorosCongo, Dem. Rep.Congo, Rep.Costa RicaCote d'IvoireCroatiaCubaCuracaoCyprusCzech RepublicDenmarkDjiboutiDominicaDominican RepublicEarly-demographic dividendEast Asia & PacificEast Asia & Pacific (excluding high income)East Asia & Pacific (IDA & IBRD countries)EcuadorEgypt, Arab Rep.El SalvadorEquatorial GuineaEritreaEstoniaEthiopiaEuro areaEurope & Central AsiaEurope & Central Asia (excluding high income)Europe & Central Asia (IDA & IBRD countries)European UnionFaroe IslandsFijiFinlandFragile and conflict affected situationsFranceFrench PolynesiaGabonGambia, TheGeorgiaGermanyGhanaGreeceGreenlandGrenadaGuamGuatemalaGuineaGuinea-BissauGuyanaHaitiHeavily indebted poor countries (HIPC)High incomeHondurasHong Kong SAR, ChinaHungaryIBRD onlyIcelandIDA & IBRD totalIDA blendIDA onlyIDA totalIndiaIndonesiaIran, Islamic Rep.IraqIrelandIsle of ManIsraelItalyJamaicaJapanJordanKazakhstanKenyaKiribatiKorea, Dem. People’s Rep.Korea, Rep.KuwaitKyrgyz RepublicLao PDRLate-demographic dividendLatin America & Caribbean Latin America & Caribbean (excluding high income)Latin America & the Caribbean (IDA & IBRD countries)LatviaLeast developed countries: UN classificationLebanonLesothoLiberiaLibyaLithuaniaLow & middle incomeLow incomeLower middle incomeMacao SAR, ChinaMacedonia, FYRMadagascarMalawiMalaysiaMaldivesMaliMaltaMarshall IslandsMauritaniaMauritiusMexicoMicronesia, Fed. Sts.Middle East & North AfricaMiddle East & North Africa (excluding high income)Middle East & North Africa (IDA & IBRD countries)Middle incomeMoldovaMonacoMongoliaMontenegroMoroccoMozambiqueMyanmarNamibiaNauruNepalNetherlandsNew CaledoniaNew ZealandNicaraguaNigerNigeriaNorth AmericaNorthern Mariana IslandsNorwayOECD membersOmanOther small statesPacific island small statesPakistanPalauPanamaPapua New GuineaParaguayPeruPhilippinesPolandPortugalPost-demographic dividendPre-demographic dividendPuerto RicoQatarRomaniaRussian FederationRwandaSamoaSao Tome and PrincipeSaudi ArabiaSenegalSerbiaSeychellesSierra LeoneSingaporeSint Maarten (Dutch part)Slovak RepublicSloveniaSmall statesSolomon IslandsSomaliaSouth AfricaSouth AsiaSouth Asia (IDA & IBRD)South SudanSpainSri LankaSt. Kitts and NevisSt. LuciaSt. Martin (French part)St. Vincent and the GrenadinesSub-Saharan Africa Sub-Saharan Africa (excluding high income)Sub-Saharan Africa (IDA & IBRD countries)SudanSurinameSwazilandSwedenSwitzerlandSyrian Arab RepublicTajikistanTanzaniaThailandTimor-LesteTogoTongaTrinidad and TobagoTunisiaTurkeyTurkmenistanTurks and Caicos IslandsTuvaluUgandaUkraineUnited Arab EmiratesUnited KingdomUnited StatesUpper middle incomeUruguayUzbekistanVanuatuVenezuela, RBVietnamVirgin Islands (U.S.)West Bank and GazaWorldYemen, Rep.ZambiaZimbabwe línea de tiempo (timeline):
En esta escala de tiempo se presenta un gráfico de 1961 y 2015 de Marshall Islands. Los datos de 1960 están ausentes. El número de observaciones reales por fecha: 55.
Fuente (nombre):
Indicadores del desarrollo mundial
Fuente (organización):
Food and Agriculture Organization.
Categorías:
Environment
Se ha actualizado:
23 abr 2017 año
Los indicadores de los cambios de valor en los últimos años
Máximo:
93.255 mil
1 ene 2012 año
A la fecha de observación
Valor
Cambio absoluto
El cambio con respecto al valor anterior
1 ene 1961 año
0.0
0.0
0.0%
1 ene 1967 año
100.0
+100.0
%
1 ene 1968 año
100.0
0.0
0.0%
1 ene 1969 año
100.0
0.0
0.0%
1 ene 1970 año
100.0
0.0
0.0%
1 ene 1971 año
100.0
0.0
0.0%
1 ene 1972 año
100.0
0.0
0.0%
1 ene 1973 año
100.0
0.0
0.0%
1 ene 1974 año
100.0
0.0
0.0%
1 ene 1975 año
100.0
0.0
0.0%
1 ene 1976 año
100.0
0.0
0.0%
1 ene 1977 año
100.0
0.0
0.0%
1 ene 1978 año
100.0
0.0
0.0%
1 ene 1979 año
100.0
0.0
0.0%
1 ene 1980 año
100.0
0.0
0.0%
1 ene 1981 año
150.0
+50.0
50.0%
1 ene 1982 año
150.0
0.0
0.0%
1 ene 1983 año
160.0
+10.0
6.67%
1 ene 1984 año
160.0
0.0
0.0%
1 ene 1985 año
200.0
+40.0
25.0%
1 ene 1986 año
200.0
0.0
0.0%
1 ene 1987 año
220.0
+20.0
10.0%
1 ene 1988 año
320.0
+100.0
45.45%
1 ene 1989 año
400.0
+80.0
25.0%
1 ene 1990 año
395.0
-5.0
-1.25%
1 ene 1991 año
380.0
-15.0
-3.8%
1 ene 1992 año
300.0
-80.0
-21.05%
1 ene 1993 año
329.0
+29.0
9.67%
1 ene 1994 año
488.0
+159.0
48.33%
1 ene 1995 año
388.0
-100.0
-20.49%
1 ene 1996 año
375.0
-13.0
-3.35%
1 ene 1997 año
2.772 mil
+2.397 mil
639.2%
1 ene 1998 año
400.0
-2.372 mil
-85.57%
1 ene 1999 año
500.0
+100.0
25.0%
1 ene 2000 año
700.0
+200.0
40.0%
1 ene 2001 año
8.261 mil
+7.561 mil
1.08 mil%
1 ene 2002 año
36.581 mil
+28.32 mil
342.82%
1 ene 2003 año
39.859 mil
+3.278 mil
8.96%
1 ene 2004 año
38.885 mil
-974.0
-2.44%
1 ene 2005 año
47.887 mil
+9.002 mil
23.15%
1 ene 2006 año
57.583 mil
+9.696 mil
20.25%
1 ene 2007 año
43.974 mil
-13.609 mil
-23.63%
1 ene 2008 año
61.23 mil
+17.256 mil
39.24%
1 ene 2009 año
35.103 mil
-26.127 mil
-42.67%
1 ene 2010 año
46.292 mil
+11.189 mil
31.87%
1 ene 2011 año
59.732 mil
+13.44 mil
29.03%
1 ene 2012 año
93.255 mil
+33.523 mil
56.12%
1 ene 2013 año
75.356 mil
-17.899 mil
-19.19%
1 ene 2014 año
80.616 mil
+5.26 mil
6.98%
1 ene 2015 año
78.713 mil
-1.903 mil
-2.36%
Ranking de los países por los datos estadísticos actuales


Comentarios: