29
/es/
es
AIzaSyAYiBZKx7MnpbEhh9jyipgxe19OcubqV5w
April 1, 2024
189829
Mali
MLI
true
2
1
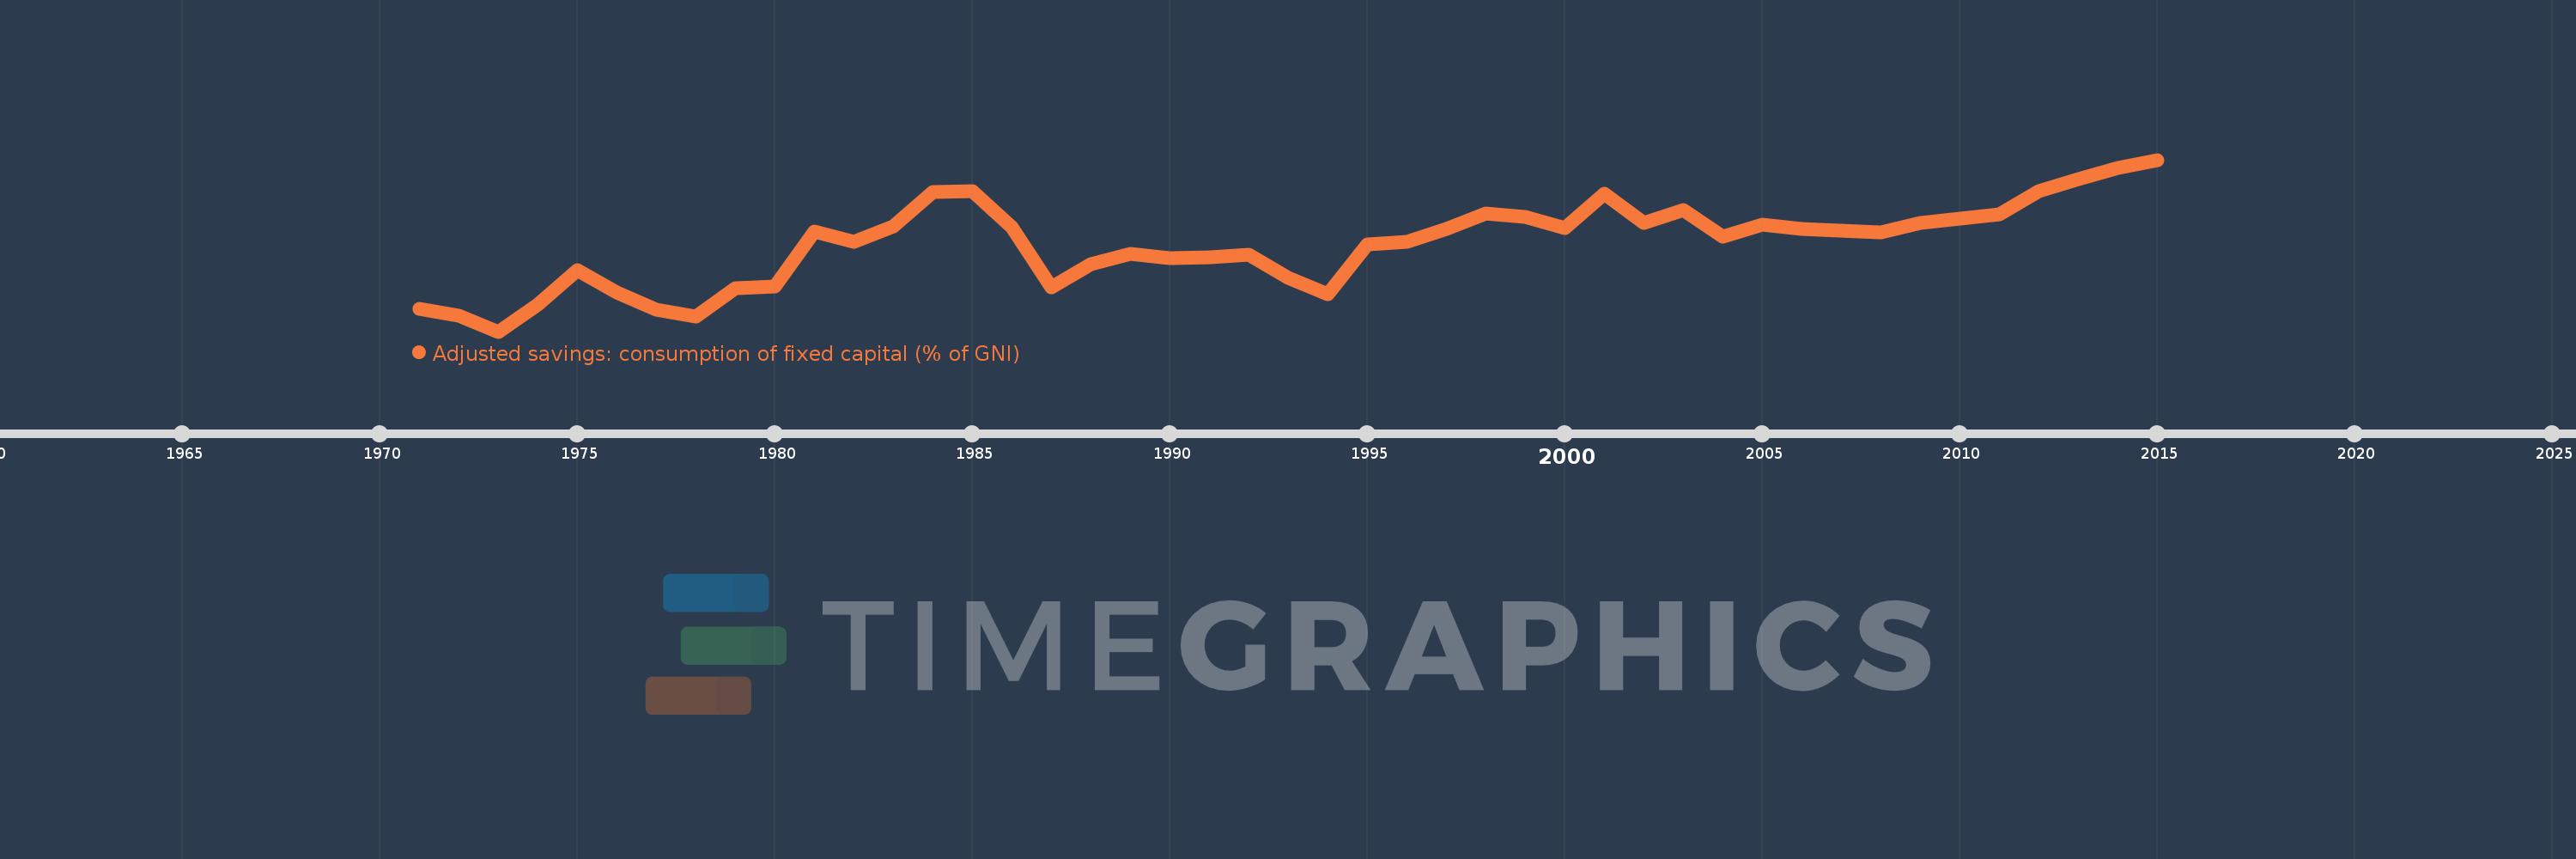
Adjusted savings: consumption of fixed capital (% of GNI)
2015,2014,2013,2012,2011,2010,2009,2008,2007,2006,2005,2004,2003,2002,2001,2000,1999,1998,1997,1996,1995,1994,1993,1992,1991,1990,1989,1988,1987,1986,1985,1984,1983,1982,1981,1980,1979,1978,1977,1976,1975,1974,1973,1972,1971
Estas estadísticas en otros países:
AfghanistanAlbaniaAlgeriaAndorraAngolaAntigua and BarbudaArab WorldArgentinaArmeniaAustraliaAustriaAzerbaijanBahamas, TheBahrainBangladeshBarbadosBelarusBelgiumBelizeBeninBermudaBhutanBoliviaBosnia and HerzegovinaBotswanaBrazilBrunei DarussalamBulgariaBurkina FasoBurundiCabo VerdeCambodiaCameroonCanadaCaribbean small statesCentral African RepublicCentral Europe and the BalticsChadChileChinaColombiaComorosCongo, Dem. Rep.Congo, Rep.Costa RicaCote d'IvoireCroatiaCubaCyprusCzech RepublicDenmarkDjiboutiDominicaDominican RepublicEarly-demographic dividendEast Asia & PacificEast Asia & Pacific (excluding high income)East Asia & Pacific (IDA & IBRD countries)EcuadorEgypt, Arab Rep.El SalvadorEquatorial GuineaEritreaEstoniaEthiopiaEuro areaEurope & Central AsiaEurope & Central Asia (excluding high income)Europe & Central Asia (IDA & IBRD countries)European UnionFijiFinlandFragile and conflict affected situationsFranceGabonGambia, TheGeorgiaGermanyGhanaGreeceGreenlandGrenadaGuatemalaGuineaGuinea-BissauGuyanaHaitiHeavily indebted poor countries (HIPC)High incomeHondurasHong Kong SAR, ChinaHungaryIBRD onlyIcelandIDA & IBRD totalIDA blendIDA onlyIDA totalIndiaIndonesiaIran, Islamic Rep.IraqIrelandIsraelItalyJamaicaJapanJordanKazakhstanKenyaKiribatiKorea, Rep.KosovoKuwaitKyrgyz RepublicLao PDRLate-demographic dividendLatin America & Caribbean Latin America & Caribbean (excluding high income)Latin America & the Caribbean (IDA & IBRD countries)LatviaLeast developed countries: UN classificationLebanonLesothoLiberiaLibyaLiechtensteinLithuaniaLow & middle incomeLow incomeLower middle incomeLuxembourgMacao SAR, ChinaMacedonia, FYRMadagascarMalawiMalaysiaMaldivesMaliMaltaMarshall IslandsMauritaniaMauritiusMexicoMicronesia, Fed. Sts.Middle East & North AfricaMiddle East & North Africa (excluding high income)Middle East & North Africa (IDA & IBRD countries)Middle incomeMoldovaMonacoMongoliaMontenegroMoroccoMozambiqueMyanmarNamibiaNepalNetherlandsNew ZealandNicaraguaNigerNigeriaNorth AmericaNorwayOECD membersOmanOther small statesPacific island small statesPakistanPalauPanamaPapua New GuineaParaguayPeruPhilippinesPolandPortugalPost-demographic dividendPre-demographic dividendPuerto RicoQatarRomaniaRussian FederationRwandaSamoaSan MarinoSao Tome and PrincipeSaudi ArabiaSenegalSerbiaSeychellesSierra LeoneSingaporeSlovak RepublicSloveniaSmall statesSolomon IslandsSouth AfricaSouth AsiaSouth Asia (IDA & IBRD)SpainSri LankaSt. Kitts and NevisSt. LuciaSt. Vincent and the GrenadinesSub-Saharan Africa Sub-Saharan Africa (excluding high income)Sub-Saharan Africa (IDA & IBRD countries)SudanSurinameSwazilandSwedenSwitzerlandSyrian Arab RepublicTajikistanTanzaniaThailandTimor-LesteTogoTongaTrinidad and TobagoTunisiaTurkeyTurkmenistanTuvaluUgandaUkraineUnited Arab EmiratesUnited KingdomUnited StatesUpper middle incomeUruguayUzbekistanVanuatuVenezuela, RBVietnamWest Bank and GazaWorldYemen, Rep.ZambiaZimbabwe línea de tiempo (timeline):
En esta escala de tiempo se presenta un gráfico de 1971 y 2015 de Mali. Los datos de 1970 están ausentes. El número de observaciones reales por fecha: 45.
Fuente (nombre):
Indicadores del desarrollo mundial
Fuente (organización):
World Bank staff estimates using data from the United Nations Statistics Division's National Accounts Statistics.
Categorías:
Economy & Growth, Environment
Se ha actualizado:
23 abr 2017 año
Los indicadores de los cambios de valor en los últimos años
Mínimo:
2.568
1 ene 1973 año
Máximo:
5.683
1 ene 2015 año
A la fecha de observación
Valor
Cambio absoluto
El cambio con respecto al valor anterior
1 ene 1971 año
2.983
+2.983
0.0%
1 ene 1972 año
2.858
-0.125
-4.2%
1 ene 1973 año
2.568
-0.29
-10.14%
1 ene 1974 año
3.06
+0.492
19.16%
1 ene 1975 año
3.68
+0.62
20.27%
1 ene 1976 año
3.282
-0.398
-10.82%
1 ene 1977 año
2.97
-0.312
-9.51%
1 ene 1978 año
2.833
-0.137
-4.6%
1 ene 1979 año
3.356
+0.523
18.45%
1 ene 1980 año
3.378
+0.022
0.66%
1 ene 1981 año
4.385
+1.006
29.79%
1 ene 1982 año
4.189
-0.196
-4.46%
1 ene 1983 año
4.479
+0.29
6.91%
1 ene 1984 año
5.098
+0.619
13.82%
1 ene 1985 año
5.117
+0.019
0.37%
1 ene 1986 año
4.465
-0.651
-12.73%
1 ene 1987 año
3.363
-1.102
-24.68%
1 ene 1988 año
3.796
+0.433
12.87%
1 ene 1989 año
3.977
+0.18
4.75%
1 ene 1990 año
3.903
-0.073
-1.85%
1 ene 1991 año
3.918
+0.015
0.37%
1 ene 1992 año
3.969
+0.051
1.31%
1 ene 1993 año
3.537
-0.432
-10.89%
1 ene 1994 año
3.241
-0.296
-8.36%
1 ene 1995 año
4.142
+0.901
27.79%
1 ene 1996 año
4.198
+0.056
1.36%
1 ene 1997 año
4.428
+0.23
5.48%
1 ene 1998 año
4.702
+0.274
6.19%
1 ene 1999 año
4.642
-0.06
-1.28%
1 ene 2000 año
4.445
-0.197
-4.25%
1 ene 2001 año
5.065
+0.62
13.96%
1 ene 2002 año
4.543
-0.522
-10.31%
1 ene 2003 año
4.772
+0.23
5.05%
1 ene 2004 año
4.288
-0.485
-10.16%
1 ene 2005 año
4.509
+0.222
5.17%
1 ene 2006 año
4.427
-0.082
-1.81%
1 ene 2007 año
4.403
-0.024
-0.55%
1 ene 2008 año
4.373
-0.03
-0.67%
1 ene 2009 año
4.532
+0.159
3.63%
1 ene 2010 año
4.613
+0.081
1.79%
1 ene 2011 año
4.687
+0.074
1.6%
1 ene 2012 año
5.107
+0.42
8.97%
1 ene 2013 año
5.328
+0.22
4.32%
1 ene 2014 año
5.529
+0.201
3.77%
1 ene 2015 año
5.683
+0.154
2.79%
Ranking de los países por los datos estadísticos actuales


Comentarios: