29
/es/
es
AIzaSyAYiBZKx7MnpbEhh9jyipgxe19OcubqV5w
April 1, 2024
187309
Malawi
MWI
true
2
1
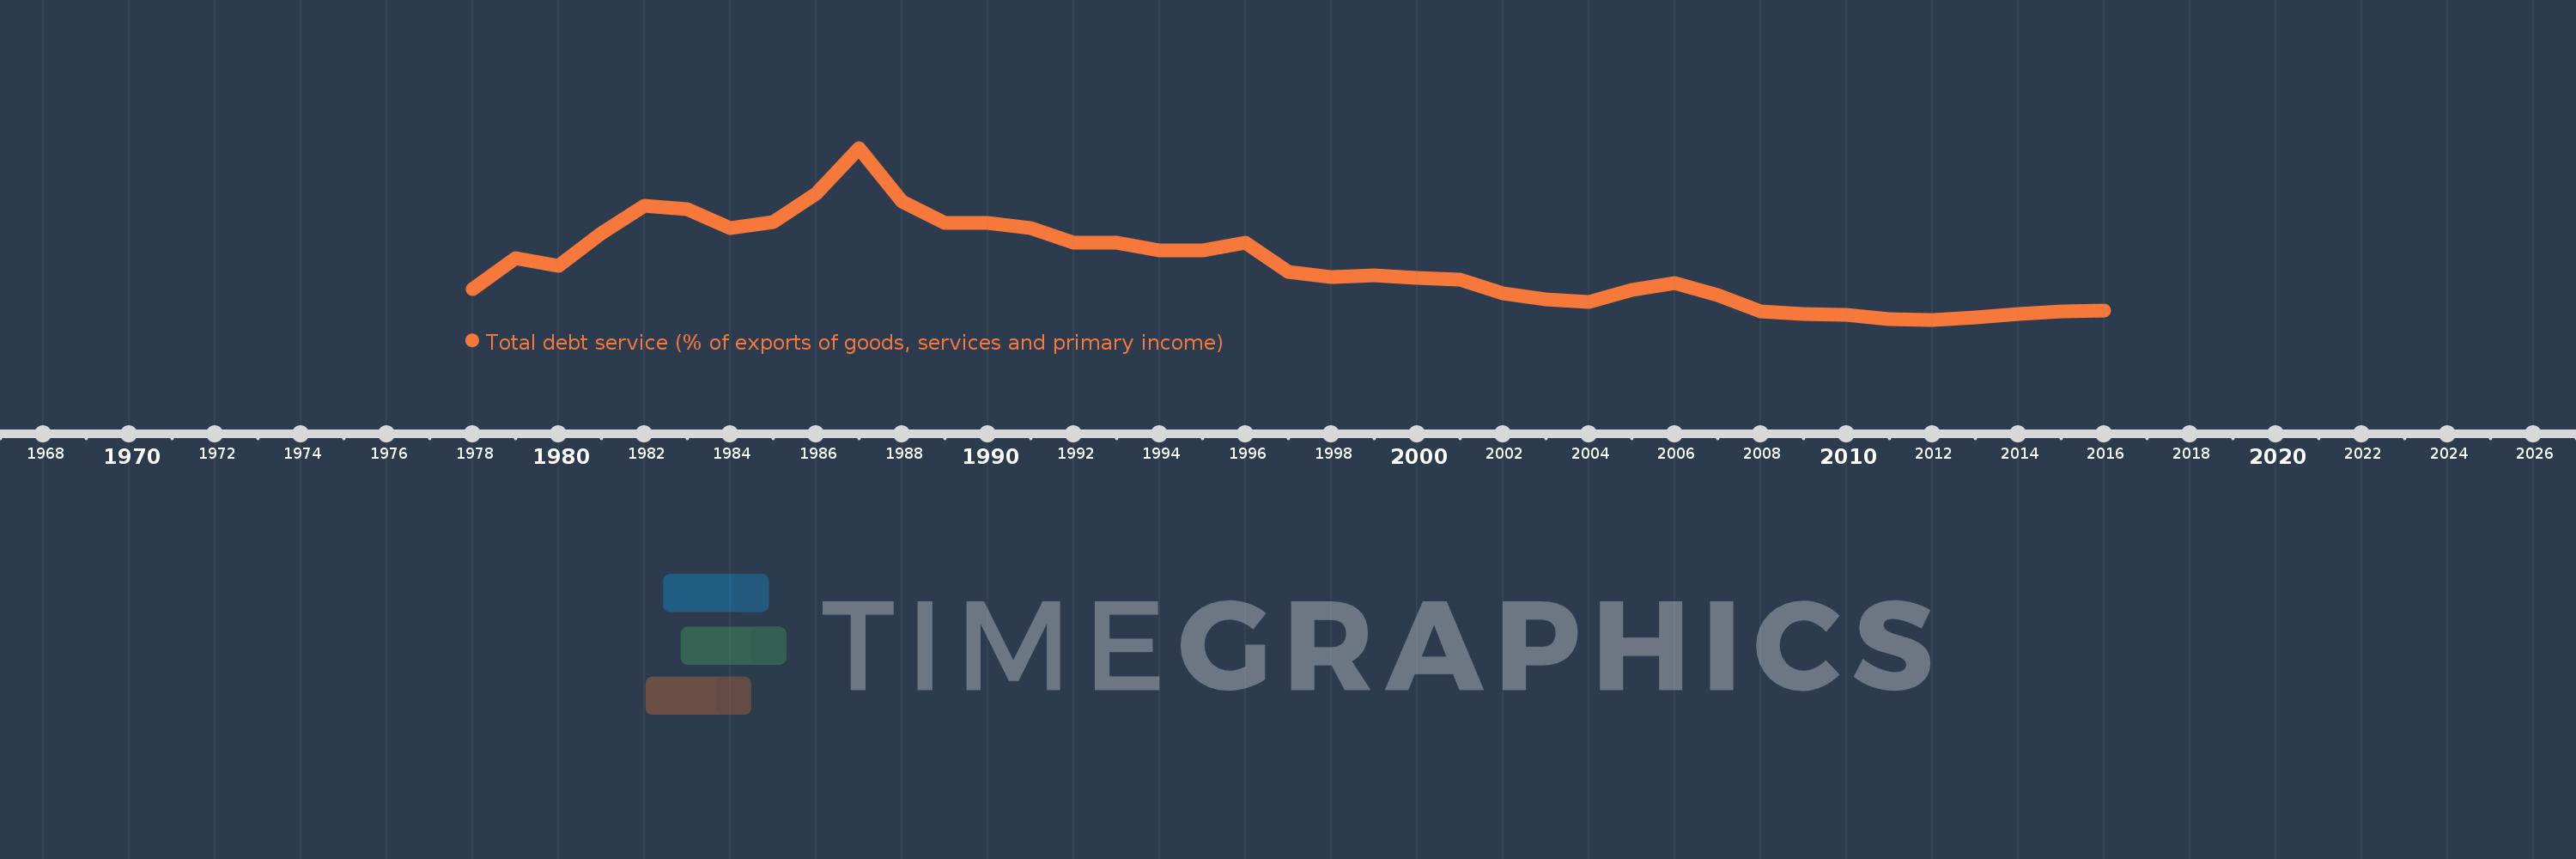
Total debt service (% of exports of goods, services and primary income)
2016,2015,2014,2013,2012,2011,2010,2009,2008,2007,2006,2005,2004,2003,2002,2001,2000,1999,1998,1997,1996,1995,1994,1993,1992,1991,1990,1989,1988,1987,1986,1985,1984,1983,1982,1981,1980,1979,1978
Estas estadísticas en otros países:
línea de tiempo (timeline):
En esta escala de tiempo se presenta un gráfico de 1978 y 2016 de Malawi. Los datos de 1977 están ausentes. El número de observaciones reales por fecha: 39.
Fuente (nombre):
Indicadores del desarrollo mundial
Fuente (organización):
World Bank, International Debt Statistics.
Categorías:
Economy & Growth, External Debt
Se ha actualizado:
23 abr 2017 año
Los indicadores de los cambios de valor en los últimos años
Mínimo:
1.396
1 ene 2012 año
Máximo:
53.693
1 ene 1987 año
A la fecha de observación
Valor
Cambio absoluto
El cambio con respecto al valor anterior
1 ene 1978 año
10.748
+10.748
0.0%
1 ene 1979 año
20.115
+9.367
87.14%
1 ene 1980 año
17.787
-2.328
-11.57%
1 ene 1981 año
27.783
+9.995
56.19%
1 ene 1982 año
36.041
+8.258
29.73%
1 ene 1983 año
35.029
-1.012
-2.81%
1 ene 1984 año
29.265
-5.764
-16.45%
1 ene 1985 año
31.066
+1.8
6.15%
1 ene 1986 año
39.843
+8.777
28.25%
1 ene 1987 año
53.693
+13.85
34.76%
1 ene 1988 año
37.432
-16.261
-30.29%
1 ene 1989 año
30.886
-6.546
-17.49%
1 ene 1990 año
30.919
+0.033
0.11%
1 ene 1991 año
29.319
-1.6
-5.17%
1 ene 1992 año
24.871
-4.448
-15.17%
1 ene 1993 año
24.859
-0.012
-0.05%
1 ene 1994 año
22.378
-2.481
-9.98%
1 ene 1995 año
22.485
+0.107
0.48%
1 ene 1996 año
24.94
+2.454
10.91%
1 ene 1997 año
15.909
-9.031
-36.21%
1 ene 1998 año
14.391
-1.518
-9.54%
1 ene 1999 año
14.863
+0.472
3.28%
1 ene 2000 año
14.091
-0.772
-5.2%
1 ene 2001 año
13.504
-0.587
-4.16%
1 ene 2002 año
9.527
-3.978
-29.45%
1 ene 2003 año
7.721
-1.805
-18.95%
1 ene 2004 año
6.742
-0.979
-12.68%
1 ene 2005 año
10.542
+3.8
56.36%
1 ene 2006 año
12.501
+1.959
18.58%
1 ene 2007 año
8.878
-3.623
-28.98%
1 ene 2008 año
3.832
-5.047
-56.84%
1 ene 2009 año
3.121
-0.711
-18.54%
1 ene 2010 año
2.86
-0.261
-8.36%
1 ene 2011 año
1.706
-1.154
-40.34%
1 ene 2012 año
1.396
-0.311
-18.22%
1 ene 2013 año
2.055
+0.66
47.27%
1 ene 2014 año
3.173
+1.118
54.4%
1 ene 2015 año
3.959
+0.785
24.75%
1 ene 2016 año
4.254
+0.295
7.45%
Ranking de los países por los datos estadísticos actuales


Comentarios: