29
/es/
es
AIzaSyAYiBZKx7MnpbEhh9jyipgxe19OcubqV5w
April 1, 2024
186577
Malawi
MWI
true
2
1
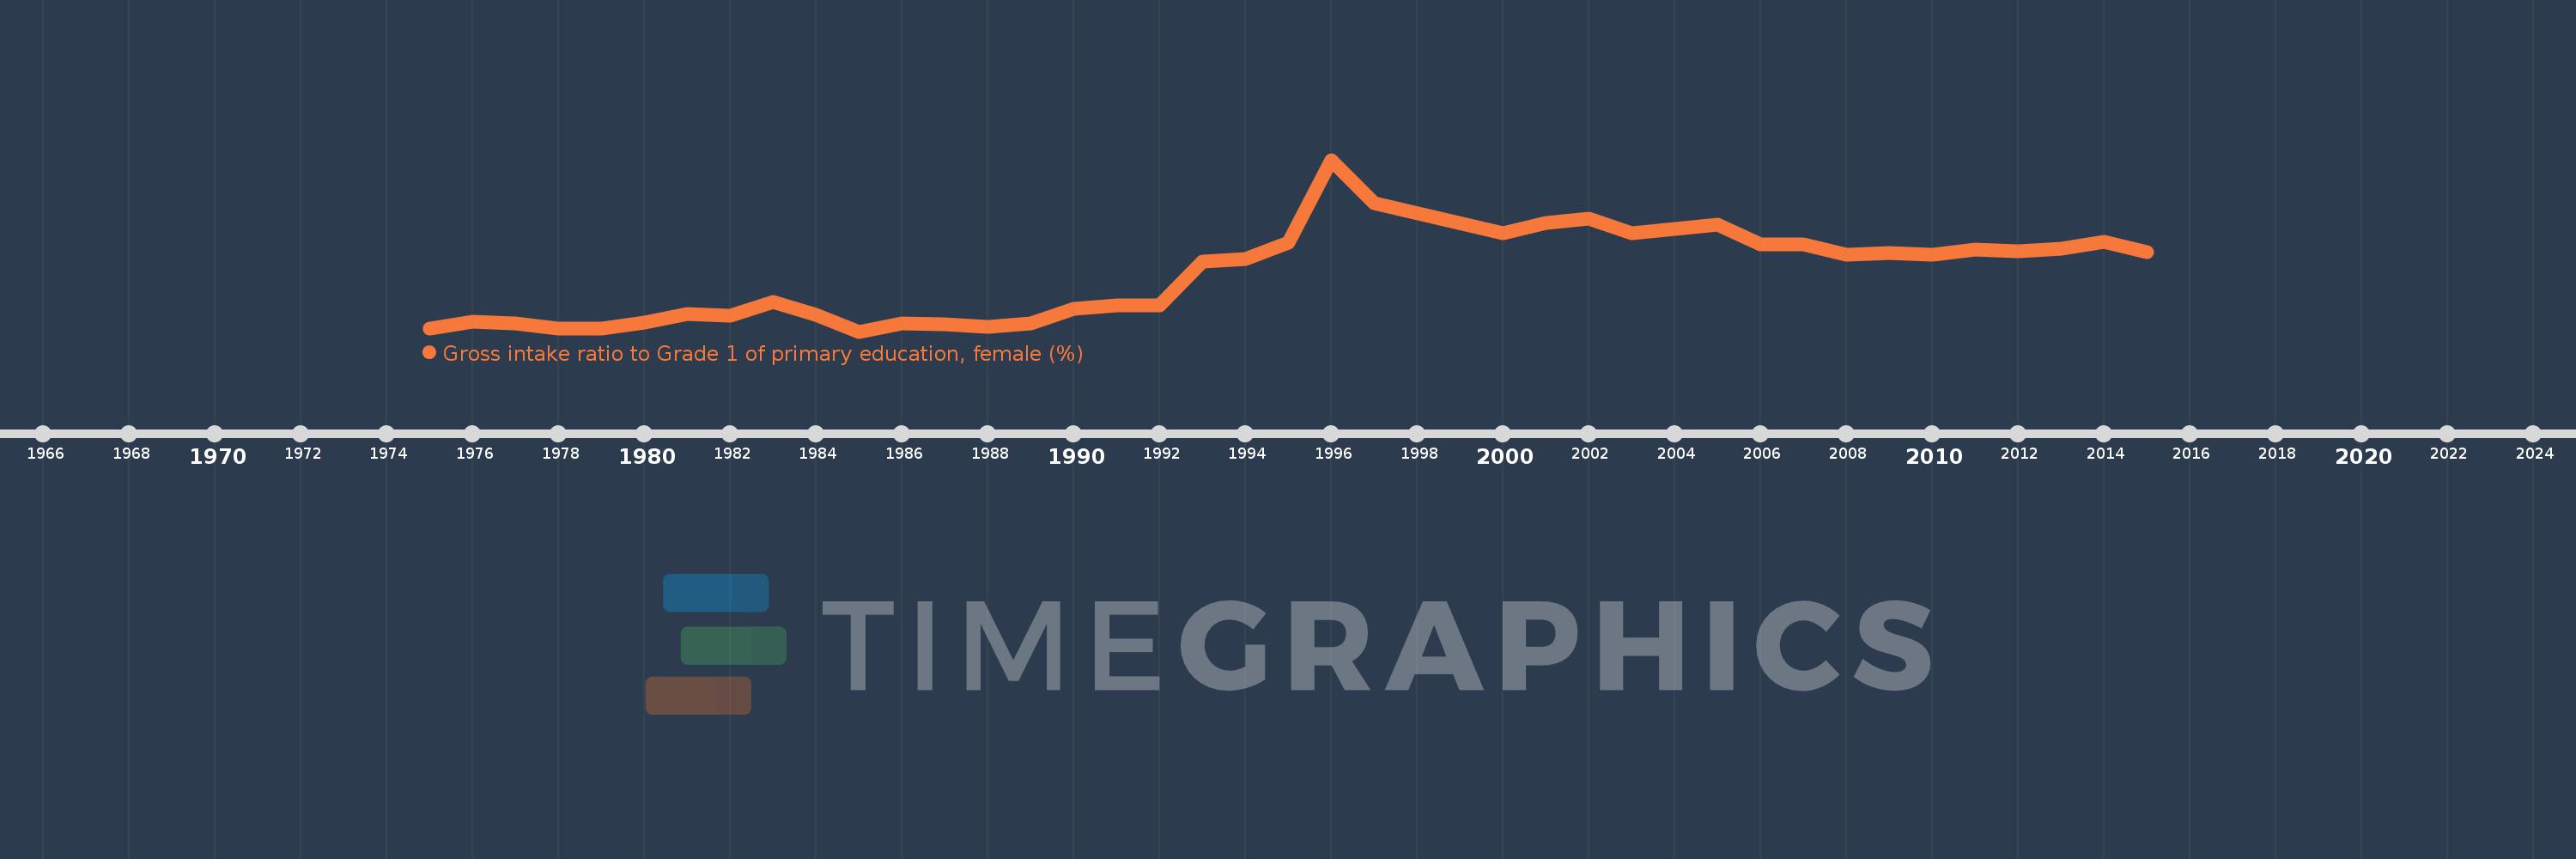
Gross intake ratio to Grade 1 of primary education, female (%)
2015,2014,2013,2012,2011,2010,2009,2008,2007,2006,2005,2003,2002,2001,2000,1997,1996,1995,1994,1993,1992,1991,1990,1989,1988,1987,1986,1985,1984,1983,1982,1981,1980,1979,1978,1977,1976,1975
Estas estadísticas en otros países:
AfghanistanAlbaniaAlgeriaAngolaAntigua and BarbudaArab WorldArgentinaArmeniaArubaAustriaAzerbaijanBahamas, TheBahrainBangladeshBarbadosBelarusBelgiumBelizeBeninBermudaBhutanBoliviaBosnia and HerzegovinaBotswanaBrazilBrunei DarussalamBulgariaBurkina FasoBurundiCabo VerdeCambodiaCameroonCanadaCaribbean small statesCentral African RepublicCentral Europe and the BalticsChadChileChinaColombiaComorosCongo, Dem. Rep.Congo, Rep.Costa RicaCote d'IvoireCroatiaCubaCyprusCzech RepublicDenmarkDjiboutiDominicaDominican RepublicEarly-demographic dividendEast Asia & PacificEast Asia & Pacific (excluding high income)East Asia & Pacific (IDA & IBRD countries)EcuadorEgypt, Arab Rep.El SalvadorEquatorial GuineaEritreaEstoniaEthiopiaEuro areaEurope & Central AsiaEurope & Central Asia (excluding high income)Europe & Central Asia (IDA & IBRD countries)European UnionFijiFinlandFragile and conflict affected situationsFranceGabonGambia, TheGeorgiaGermanyGhanaGreeceGrenadaGuatemalaGuineaGuinea-BissauGuyanaHaitiHeavily indebted poor countries (HIPC)High incomeHondurasHong Kong SAR, ChinaHungaryIBRD onlyIcelandIDA & IBRD totalIDA blendIDA onlyIDA totalIndiaIndonesiaIran, Islamic Rep.IraqIrelandIsraelItalyJamaicaJapanJordanKazakhstanKenyaKiribatiKorea, Dem. People’s Rep.Korea, Rep.KuwaitKyrgyz RepublicLao PDRLate-demographic dividendLatin America & Caribbean Latin America & Caribbean (excluding high income)Latin America & the Caribbean (IDA & IBRD countries)LatviaLeast developed countries: UN classificationLebanonLesothoLiberiaLibyaLiechtensteinLithuaniaLow & middle incomeLow incomeLower middle incomeLuxembourgMacao SAR, ChinaMacedonia, FYRMadagascarMalawiMaldivesMaliMaltaMarshall IslandsMauritaniaMauritiusMexicoMicronesia, Fed. Sts.Middle East & North AfricaMiddle East & North Africa (excluding high income)Middle East & North Africa (IDA & IBRD countries)Middle incomeMoldovaMongoliaMontenegroMoroccoMozambiqueMyanmarNamibiaNauruNepalNetherlandsNew ZealandNicaraguaNigerNigeriaNorth AmericaNorwayOECD membersOmanOther small statesPacific island small statesPakistanPalauPanamaPapua New GuineaParaguayPeruPhilippinesPolandPortugalPost-demographic dividendPre-demographic dividendPuerto RicoQatarRomaniaRussian FederationRwandaSamoaSan MarinoSao Tome and PrincipeSaudi ArabiaSenegalSerbiaSeychellesSierra LeoneSlovak RepublicSloveniaSmall statesSolomon IslandsSouth AfricaSouth AsiaSouth Asia (IDA & IBRD)South SudanSpainSri LankaSt. Kitts and NevisSt. LuciaSt. Vincent and the GrenadinesSub-Saharan Africa Sub-Saharan Africa (excluding high income)Sub-Saharan Africa (IDA & IBRD countries)SudanSurinameSwazilandSwedenSwitzerlandSyrian Arab RepublicTajikistanTanzaniaThailandTimor-LesteTogoTongaTrinidad and TobagoTunisiaTurkeyTuvaluUgandaUkraineUnited Arab EmiratesUnited StatesUpper middle incomeUruguayUzbekistanVanuatuVenezuela, RBVietnamWest Bank and GazaWorldYemen, Rep.ZambiaZimbabwe línea de tiempo (timeline):
En esta escala de tiempo se presenta un gráfico de 1975 y 2015 de Malawi. Los datos de 1974 están ausentes. El número de observaciones reales por fecha: 38.
Fuente (nombre):
Indicadores del desarrollo mundial
Fuente (organización):
UNESCO Institute for Statistics
Categorías:
Education, Gender
Se ha actualizado:
23 abr 2017 año
Los indicadores de los cambios de valor en los últimos años
Mínimo:
71.017
1 ene 1985 año
Máximo:
256.824
1 ene 1996 año
A la fecha de observación
Valor
Cambio absoluto
El cambio con respecto al valor anterior
1 ene 1975 año
74.703
+74.703
0.0%
1 ene 1976 año
81.727
+7.024
9.4%
1 ene 1977 año
79.771
-1.956
-2.39%
1 ene 1978 año
74.269
-5.502
-6.9%
1 ene 1979 año
74.684
+0.415
0.56%
1 ene 1980 año
81.109
+6.425
8.6%
1 ene 1981 año
90.106
+8.996
11.09%
1 ene 1982 año
88.062
-2.043
-2.27%
1 ene 1983 año
102.657
+14.594
16.57%
1 ene 1984 año
88.797
-13.86
-13.5%
1 ene 1985 año
71.017
-17.78
-20.02%
1 ene 1986 año
79.975
+8.958
12.61%
1 ene 1987 año
78.808
-1.167
-1.46%
1 ene 1988 año
76.169
-2.638
-3.35%
1 ene 1989 año
79.94
+3.77
4.95%
1 ene 1990 año
95.205
+15.265
19.1%
1 ene 1991 año
99.544
+4.339
4.56%
1 ene 1992 año
99.277
-0.266
-0.27%
1 ene 1993 año
146.604
+47.326
47.67%
1 ene 1994 año
149.489
+2.886
1.97%
1 ene 1995 año
167.59
+18.101
12.11%
1 ene 1996 año
256.824
+89.234
53.25%
1 ene 1997 año
210.025
-46.799
-18.22%
1 ene 2000 año
177.741
-32.285
-15.37%
1 ene 2001 año
188.583
+10.842
6.1%
1 ene 2002 año
192.733
+4.15
2.2%
1 ene 2003 año
177.624
-15.108
-7.84%
1 ene 2005 año
186.346
+8.722
4.91%
1 ene 2006 año
165.304
-21.042
-11.29%
1 ene 2007 año
164.988
-0.316
-0.19%
1 ene 2008 año
154.461
-10.527
-6.38%
1 ene 2009 año
155.624
+1.163
0.75%
1 ene 2010 año
153.719
-1.906
-1.22%
1 ene 2011 año
159.763
+6.045
3.93%
1 ene 2012 año
157.571
-2.192
-1.37%
1 ene 2013 año
160.787
+3.216
2.04%
1 ene 2014 año
168.13
+7.343
4.57%
1 ene 2015 año
156.933
-11.198
-6.66%
Ranking de los países por los datos estadísticos actuales


Comentarios: