29
/es/
es
AIzaSyAYiBZKx7MnpbEhh9jyipgxe19OcubqV5w
April 1, 2024
183420
Macao SAR, China
MAC
true
2
1
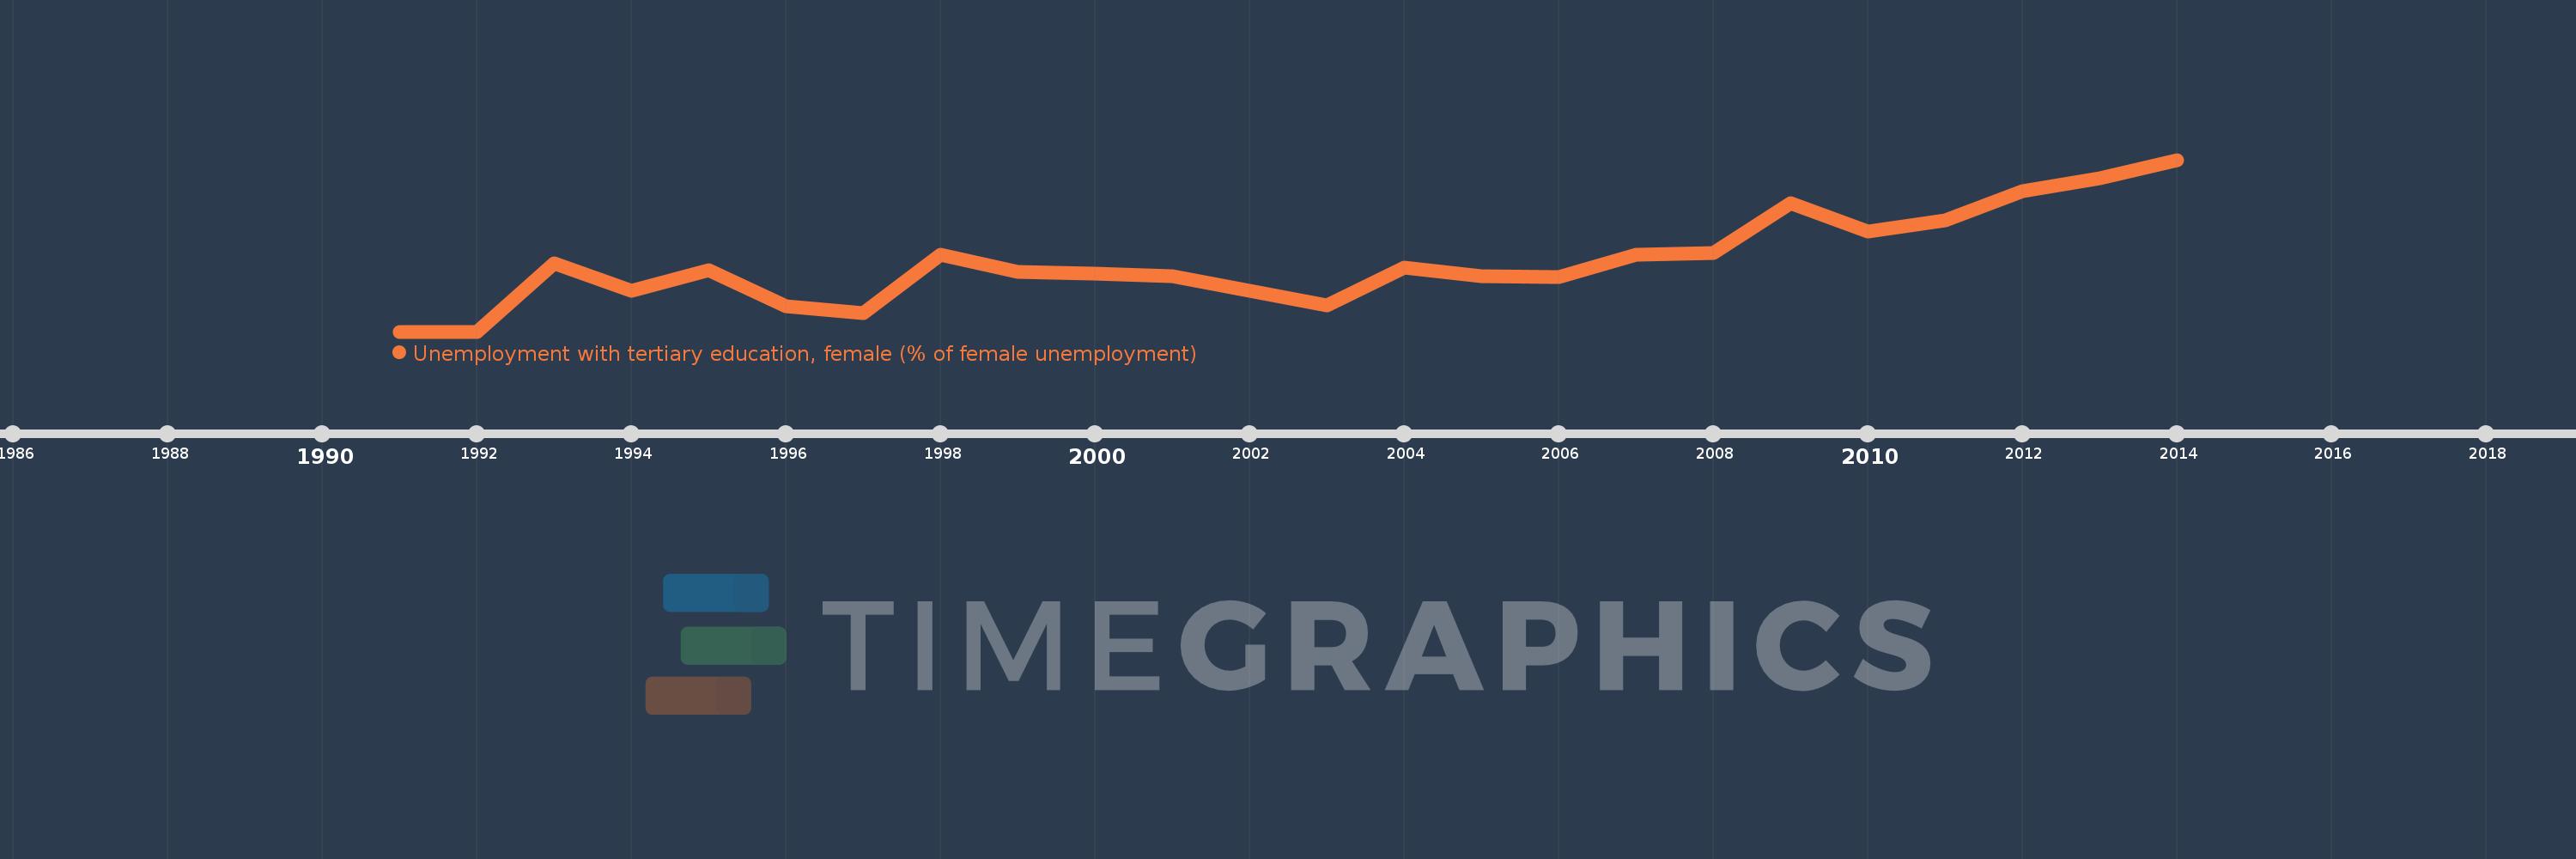
Unemployment with tertiary education, female (% of female unemployment)
2014,2013,2012,2011,2010,2009,2008,2007,2006,2005,2004,2003,2002,2001,2000,1999,1998,1997,1996,1995,1994,1993,1992,1991
Estas estadísticas en otros países:
línea de tiempo (timeline):
En esta escala de tiempo se presenta un gráfico de 1991 y 2014 de Macao SAR, China. Los datos de 1990 están ausentes. El número de observaciones reales por fecha: 24.
Fuente (nombre):
Indicadores del desarrollo mundial
Fuente (organización):
International Labour Organization, Key Indicators of the Labour Market database.
Categorías:
Social Protection & Labor, Gender
Se ha actualizado:
23 abr 2017 año
Los indicadores de los cambios de valor en los últimos años
Máximo:
28.0
1 ene 2014 año
A la fecha de observación
Valor
Cambio absoluto
El cambio con respecto al valor anterior
1 ene 1991 año
0.0
0.0
0.0%
1 ene 1993 año
11.1
+11.1
%
1 ene 1994 año
6.7
-4.4
-39.64%
1 ene 1995 año
10.0
+3.3
49.25%
1 ene 1996 año
4.2
-5.8
-58.0%
1 ene 1997 año
3.0
-1.2
-28.57%
1 ene 1998 año
12.5
+9.5
316.67%
1 ene 1999 año
9.7
-2.8
-22.4%
1 ene 2000 año
9.5
-0.2
-2.06%
1 ene 2001 año
9.1
-0.4
-4.21%
1 ene 2002 año
6.7
-2.4
-26.37%
1 ene 2003 año
4.3
-2.4
-35.82%
1 ene 2004 año
10.4
+6.1
141.86%
1 ene 2005 año
9.1
-1.3
-12.5%
1 ene 2006 año
8.9
-0.2
-2.2%
1 ene 2007 año
12.5
+3.6
40.45%
1 ene 2008 año
12.8
+0.3
2.4%
1 ene 2009 año
20.9
+8.1
63.28%
1 ene 2010 año
16.3
-4.6
-22.01%
1 ene 2011 año
18.2
+1.9
11.66%
1 ene 2012 año
22.9
+4.7
25.82%
1 ene 2013 año
25.0
+2.1
9.17%
1 ene 2014 año
28.0
+3.0
12.0%
Ranking de los países por los datos estadísticos actuales


Comentarios: