30
/es/
AIzaSyAYiBZKx7MnpbEhh9jyipgxe19OcubqV5w
April 1, 2024
180815
Lithuania
LTU
true
2
1
All education staff compensation, total (% of total expenditure in public institutions)
2013,2012,2011,2010,2009,2008,2007,2006,2005,2004
Download
Estadísticas Globales de la Biblioteca →Lithuania →

All education staff compensation, total (% of total expenditure in public institutions)

Estas estadísticas en otros países:

AfghanistanAlbaniaAndorraAntigua and BarbudaArgentinaArmeniaArubaAustraliaAustriaAzerbaijanBahrainBangladeshBarbadosBelarusBelgiumBelizeBeninBoliviaBrazilBritish Virgin IslandsBulgariaBurkina FasoBurundiCabo VerdeCameroonCanadaCaribbean small statesCayman IslandsCentral African RepublicCentral Europe and the BalticsChileChinaColombiaComorosCongo, Dem. Rep.Cote d'IvoireCroatiaCubaCuracaoCyprusCzech RepublicDenmarkDjiboutiDominicaDominican RepublicEcuadorEl SalvadorEritreaEstoniaEthiopiaEuro areaEurope & Central AsiaEurope & Central Asia (excluding high income)Europe & Central Asia (IDA & IBRD countries)European UnionFijiFinlandFranceGambia, TheGermanyGhanaGreeceGrenadaGuatemalaGuineaGuinea-BissauGuyanaHigh incomeHondurasHungaryIcelandIndiaIndonesiaIrelandIsraelItalyJamaicaJapanJordanKazakhstanKorea, Rep.KuwaitKyrgyz RepublicLate-demographic dividendLatin America & Caribbean Latin America & Caribbean (excluding high income)Latin America & the Caribbean (IDA & IBRD countries)LatviaLebanonLesothoLiberiaLiechtensteinLithuaniaLuxembourgMacao SAR, ChinaMacedonia, FYRMadagascarMalawiMalaysiaMaliMaltaMarshall IslandsMexicoMoldovaMonacoMongoliaMoroccoMozambiqueNamibiaNauruNetherlandsNicaraguaNigerNorth AmericaNorwayOECD membersOmanPakistanPanamaParaguayPeruPhilippinesPolandPortugalPost-demographic dividendPuerto RicoQatarRomaniaRussian FederationRwandaSan MarinoSenegalSerbiaSeychellesSierra LeoneSlovak RepublicSloveniaSouth AfricaSpainSri LankaSt. Kitts and NevisSt. LuciaSt. Vincent and the GrenadinesSwedenSwitzerlandThailandTimor-LesteTogoTunisiaTurkeyTurks and Caicos IslandsUgandaUkraineUnited KingdomUnited StatesUruguayVanuatuVenezuela, RBVietnamWest Bank and GazaZambia

línea de tiempo (timeline):

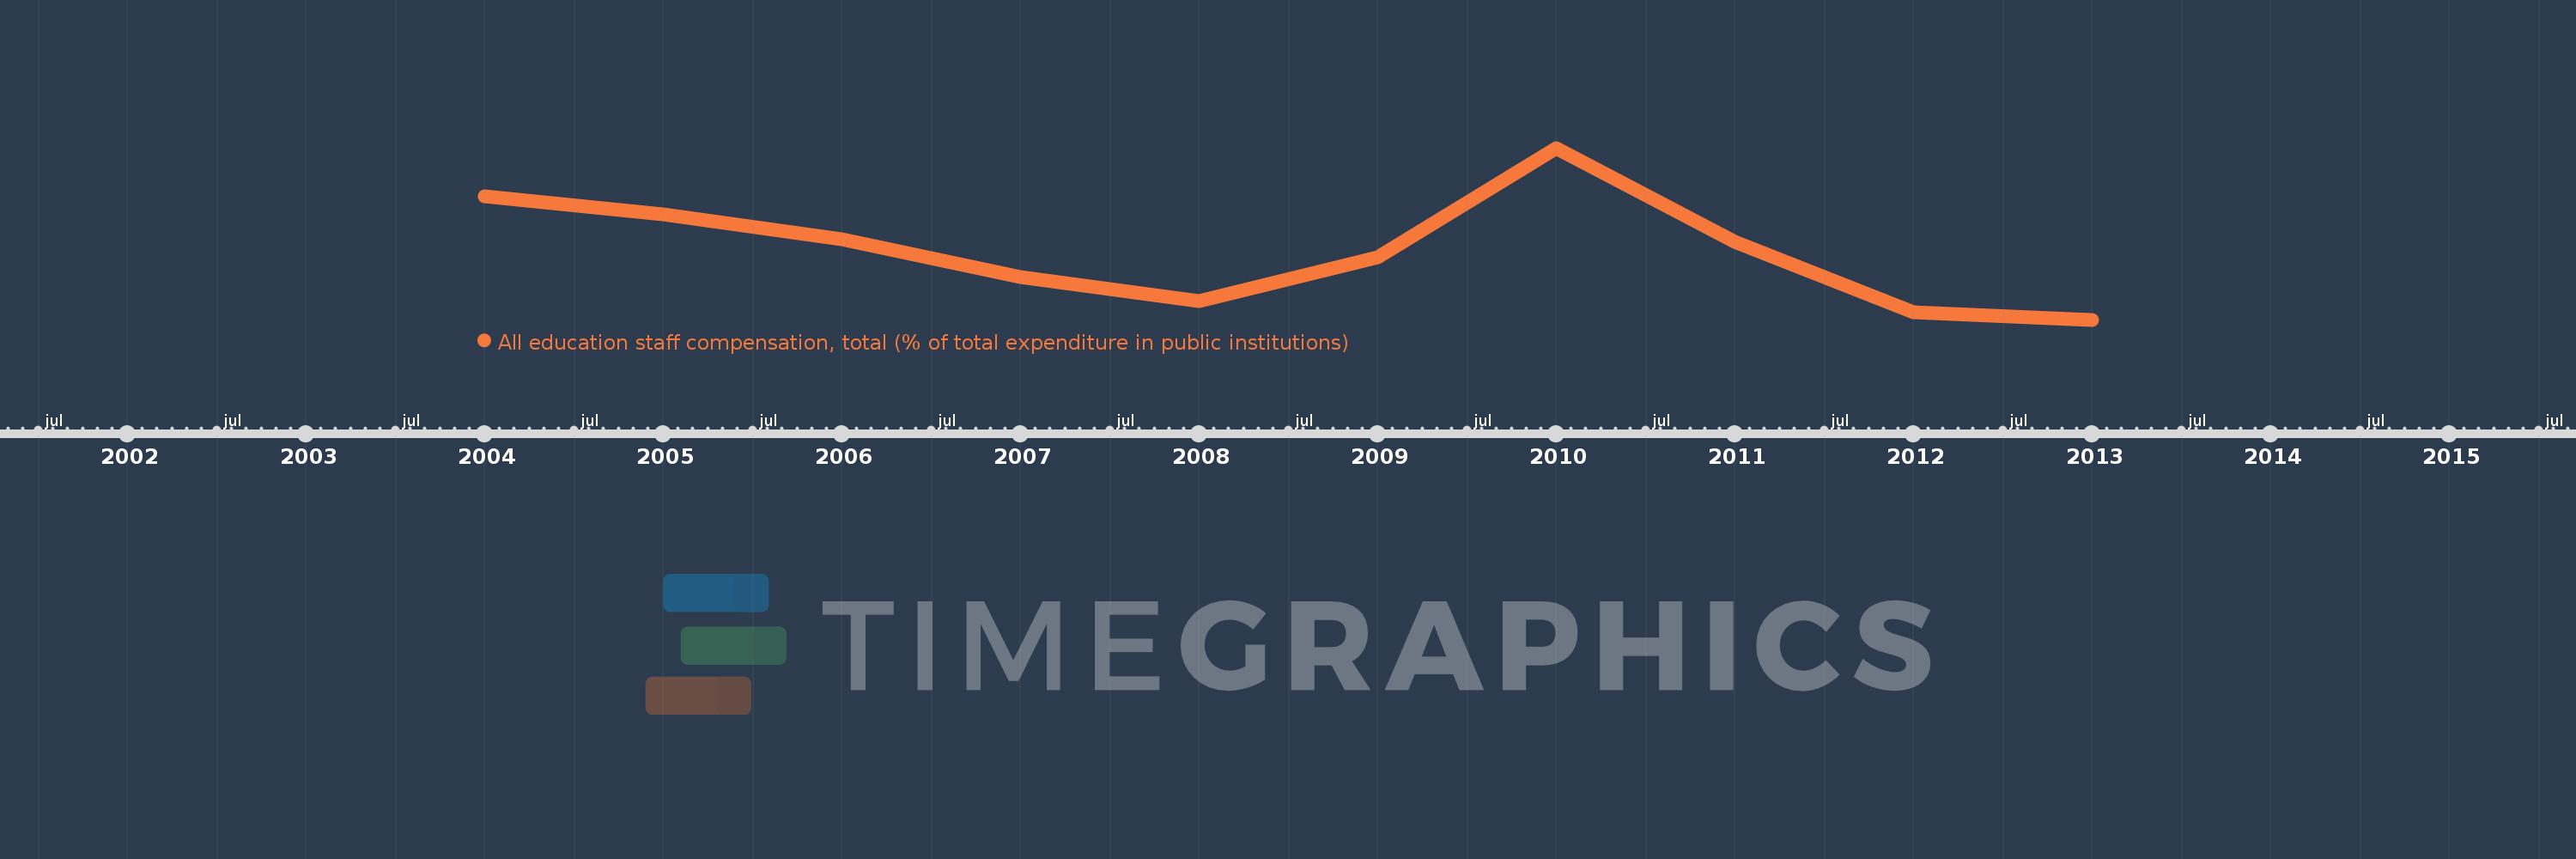
En esta escala de tiempo se presenta un gráfico de 2004 y 2013 de Lithuania. Los datos de 2003 están ausentes. El número de observaciones reales por fecha: 10.

Fuente (nombre):

Indicadores del desarrollo mundial

Fuente (organización):

United Nations Educational, Scientific, and Cultural Organization (UNESCO) Institute for Statistics.

Categorías:

Education

Se ha actualizado:

23 abr 2017 año

Los indicadores de los cambios de valor en los últimos años

En promedio:
72.218
Mínimo:
67.416
1 ene 2013 año
Máximo:
79.358
1 ene 2010 año
A la fecha de observación
Valor
Cambio absoluto
El cambio con respecto al valor anterior
1 ene 2004 año
76.008
+76.008
0.0%
1 ene 2005 año
74.73
-1.278
-1.68%
1 ene 2006 año
73.014
-1.716
-2.3%
1 ene 2007 año
70.388
-2.626
-3.6%
1 ene 2008 año
68.724
-1.664
-2.36%
1 ene 2009 año
71.733
+3.009
4.38%
1 ene 2010 año
79.358
+7.625
10.63%
1 ene 2011 año
72.85
-6.508
-8.2%
1 ene 2012 año
67.956
-4.894
-6.72%
1 ene 2013 año
67.416
-0.54
-0.79%

Ranking de los países por los datos estadísticos actuales