29
/es/
es
AIzaSyAYiBZKx7MnpbEhh9jyipgxe19OcubqV5w
April 1, 2024
173894
Lao PDR
LAO
true
2
1
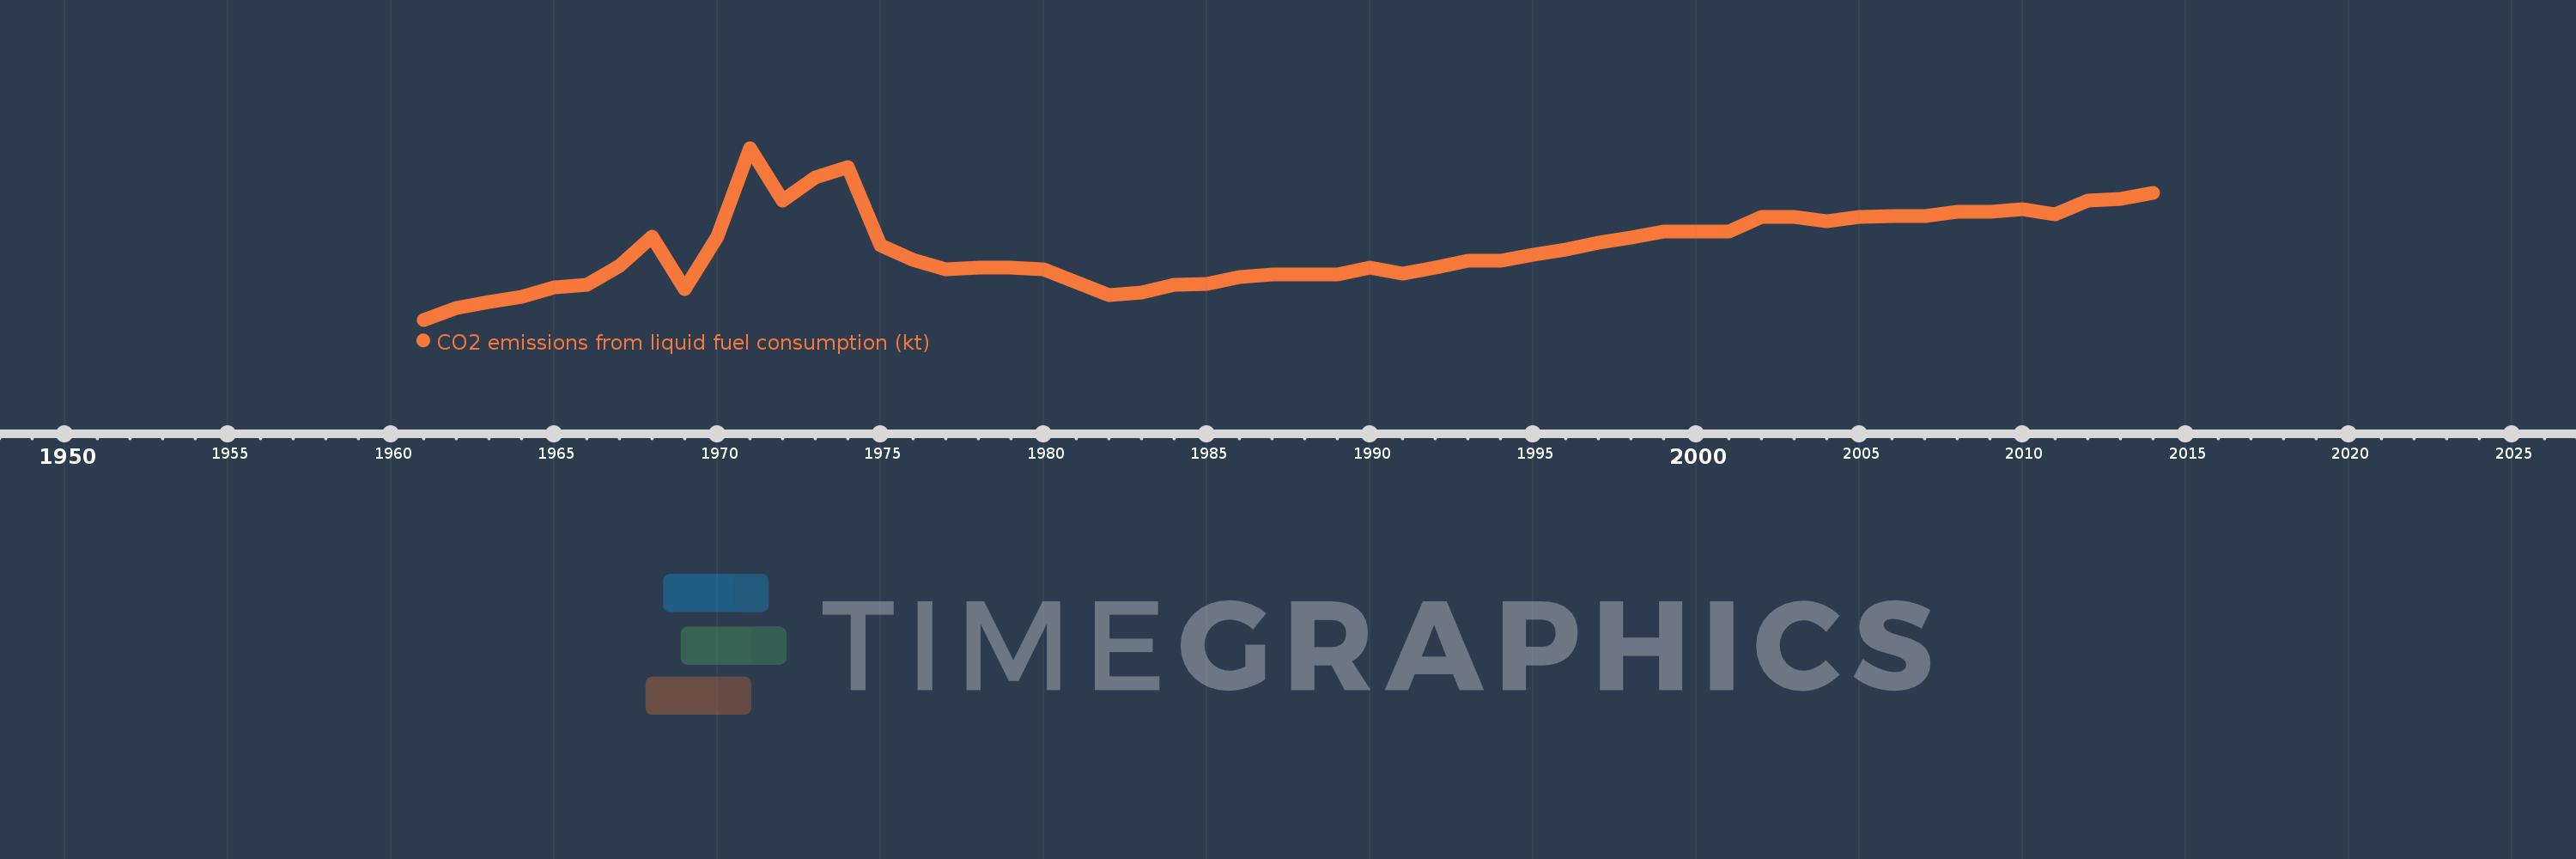
CO2 emissions from liquid fuel consumption (kt)
2014,2013,2012,2011,2010,2009,2008,2007,2006,2005,2004,2003,2002,2001,2000,1999,1998,1997,1996,1995,1994,1993,1992,1991,1990,1989,1988,1987,1986,1985,1984,1983,1982,1981,1980,1979,1978,1977,1976,1975,1974,1973,1972,1971,1970,1969,1968,1967,1966,1965,1964,1963,1962,1961
Estas estadísticas en otros países:
AfghanistanAlbaniaAlgeriaAndorraAngolaAntigua and BarbudaArab WorldArgentinaArmeniaArubaAustraliaAustriaAzerbaijanBahamas, TheBahrainBangladeshBarbadosBelarusBelgiumBelizeBeninBermudaBhutanBoliviaBosnia and HerzegovinaBotswanaBrazilBritish Virgin IslandsBrunei DarussalamBulgariaBurkina FasoBurundiCabo VerdeCambodiaCameroonCanadaCaribbean small statesCayman IslandsCentral African RepublicCentral Europe and the BalticsChadChileChinaColombiaComorosCongo, Dem. Rep.Congo, Rep.Costa RicaCote d'IvoireCroatiaCubaCuracaoCyprusCzech RepublicDenmarkDjiboutiDominicaDominican RepublicEarly-demographic dividendEast Asia & PacificEast Asia & Pacific (excluding high income)East Asia & Pacific (IDA & IBRD countries)EcuadorEgypt, Arab Rep.El SalvadorEquatorial GuineaEritreaEstoniaEthiopiaEuro areaEurope & Central AsiaEurope & Central Asia (excluding high income)Europe & Central Asia (IDA & IBRD countries)European UnionFaroe IslandsFijiFinlandFragile and conflict affected situationsFranceFrench PolynesiaGabonGambia, TheGeorgiaGermanyGhanaGibraltarGreeceGreenlandGrenadaGuatemalaGuineaGuinea-BissauGuyanaHaitiHeavily indebted poor countries (HIPC)High incomeHondurasHong Kong SAR, ChinaHungaryIBRD onlyIcelandIDA & IBRD totalIDA blendIDA onlyIDA totalIndiaIndonesiaIran, Islamic Rep.IraqIrelandIsraelItalyJamaicaJapanJordanKazakhstanKenyaKiribatiKorea, Dem. People’s Rep.Korea, Rep.KuwaitKyrgyz RepublicLao PDRLate-demographic dividendLatin America & Caribbean Latin America & Caribbean (excluding high income)Latin America & the Caribbean (IDA & IBRD countries)LatviaLeast developed countries: UN classificationLebanonLesothoLiberiaLibyaLiechtensteinLithuaniaLow & middle incomeLow incomeLower middle incomeLuxembourgMacao SAR, ChinaMacedonia, FYRMadagascarMalawiMalaysiaMaldivesMaliMaltaMarshall IslandsMauritaniaMauritiusMexicoMicronesia, Fed. Sts.Middle East & North AfricaMiddle East & North Africa (excluding high income)Middle East & North Africa (IDA & IBRD countries)Middle incomeMoldovaMongoliaMontenegroMoroccoMozambiqueMyanmarNamibiaNauruNepalNetherlandsNew CaledoniaNew ZealandNicaraguaNigerNigeriaNorth AmericaNorwayOECD membersOmanOther small statesPacific island small statesPakistanPalauPanamaPapua New GuineaParaguayPeruPhilippinesPolandPortugalPost-demographic dividendPre-demographic dividendQatarRomaniaRussian FederationRwandaSamoaSao Tome and PrincipeSaudi ArabiaSenegalSerbiaSeychellesSierra LeoneSingaporeSint Maarten (Dutch part)Slovak RepublicSloveniaSmall statesSolomon IslandsSomaliaSouth AfricaSouth AsiaSouth Asia (IDA & IBRD)South SudanSpainSri LankaSt. Kitts and NevisSt. LuciaSt. Vincent and the GrenadinesSub-Saharan Africa Sub-Saharan Africa (excluding high income)Sub-Saharan Africa (IDA & IBRD countries)SudanSurinameSwazilandSwedenSwitzerlandSyrian Arab RepublicTajikistanTanzaniaThailandTimor-LesteTogoTongaTrinidad and TobagoTunisiaTurkeyTurkmenistanTurks and Caicos IslandsUgandaUkraineUnited Arab EmiratesUnited KingdomUnited StatesUpper middle incomeUruguayUzbekistanVanuatuVenezuela, RBVietnamWest Bank and GazaWorldYemen, Rep.ZambiaZimbabwe línea de tiempo (timeline):
En esta escala de tiempo se presenta un gráfico de 1961 y 2014 de Lao PDR. Los datos de 1960 están ausentes. El número de observaciones reales por fecha: 54.
Fuente (nombre):
Indicadores del desarrollo mundial
Fuente (organización):
Carbon Dioxide Information Analysis Center, Environmental Sciences Division, Oak Ridge National Laboratory, Tennessee, United States.
Categorías:
Energy & Mining, Climate Change, Environment
Se ha actualizado:
23 abr 2017 año
Los indicadores de los cambios de valor en los últimos años
Mínimo:
80.674
1 ene 1961 año
Máximo:
572.052
1 ene 1971 año
A la fecha de observación
Valor
Cambio absoluto
El cambio con respecto al valor anterior
1 ene 1961 año
80.674
+80.674
0.0%
1 ene 1962 año
113.677
+33.003
40.91%
1 ene 1963 año
132.012
+18.335
16.13%
1 ene 1964 año
146.68
+14.668
11.11%
1 ene 1965 año
172.349
+25.669
17.5%
1 ene 1966 año
179.683
+7.334
4.26%
1 ene 1967 año
234.688
+55.005
30.61%
1 ene 1968 año
319.029
+84.341
35.94%
1 ene 1969 año
168.682
-150.347
-47.13%
1 ene 1970 año
319.029
+150.347
89.13%
1 ene 1971 año
572.052
+253.023
79.31%
1 ene 1972 año
421.705
-150.347
-26.28%
1 ene 1973 año
487.711
+66.006
15.65%
1 ene 1974 año
517.047
+29.336
6.02%
1 ene 1975 año
293.36
-223.687
-43.26%
1 ene 1976 año
253.023
-40.337
-13.75%
1 ene 1977 año
223.687
-29.336
-11.59%
1 ene 1978 año
231.021
+7.334
3.28%
1 ene 1979 año
231.021
0.0
0.0%
1 ene 1980 año
223.687
-7.334
-3.17%
1 ene 1981 año
187.017
-36.67
-16.39%
1 ene 1982 año
150.347
-36.67
-19.61%
1 ene 1983 año
157.681
+7.334
4.88%
1 ene 1984 año
179.683
+22.002
13.95%
1 ene 1985 año
183.35
+3.667
2.04%
1 ene 1986 año
201.685
+18.335
10.0%
1 ene 1987 año
209.019
+7.334
3.64%
1 ene 1988 año
209.019
0.0
0.0%
1 ene 1989 año
209.019
0.0
0.0%
1 ene 1990 año
231.021
+22.002
10.53%
1 ene 1991 año
212.686
-18.335
-7.94%
1 ene 1992 año
231.021
+18.335
8.62%
1 ene 1993 año
249.356
+18.335
7.94%
1 ene 1994 año
249.356
0.0
0.0%
1 ene 1995 año
267.691
+18.335
7.35%
1 ene 1996 año
282.359
+14.668
5.48%
1 ene 1997 año
300.694
+18.335
6.49%
1 ene 1998 año
315.362
+14.668
4.88%
1 ene 1999 año
333.697
+18.335
5.81%
1 ene 2000 año
333.697
0.0
0.0%
1 ene 2001 año
333.697
0.0
0.0%
1 ene 2002 año
374.034
+40.337
12.09%
1 ene 2003 año
374.034
0.0
0.0%
1 ene 2004 año
363.033
-11.001
-2.94%
1 ene 2005 año
374.034
+11.001
3.03%
1 ene 2006 año
377.701
+3.667
0.98%
1 ene 2007 año
377.701
0.0
0.0%
1 ene 2008 año
388.702
+11.001
2.91%
1 ene 2009 año
388.702
0.0
0.0%
1 ene 2010 año
396.036
+7.334
1.89%
1 ene 2011 año
381.368
-14.668
-3.7%
1 ene 2012 año
421.705
+40.337
10.58%
1 ene 2013 año
425.372
+3.667
0.87%
1 ene 2014 año
443.707
+18.335
4.31%
Ranking de los países por los datos estadísticos actuales


Comentarios: