29
/es/
es
AIzaSyAYiBZKx7MnpbEhh9jyipgxe19OcubqV5w
April 1, 2024
172937
Kyrgyz Republic
KGZ
true
2
1
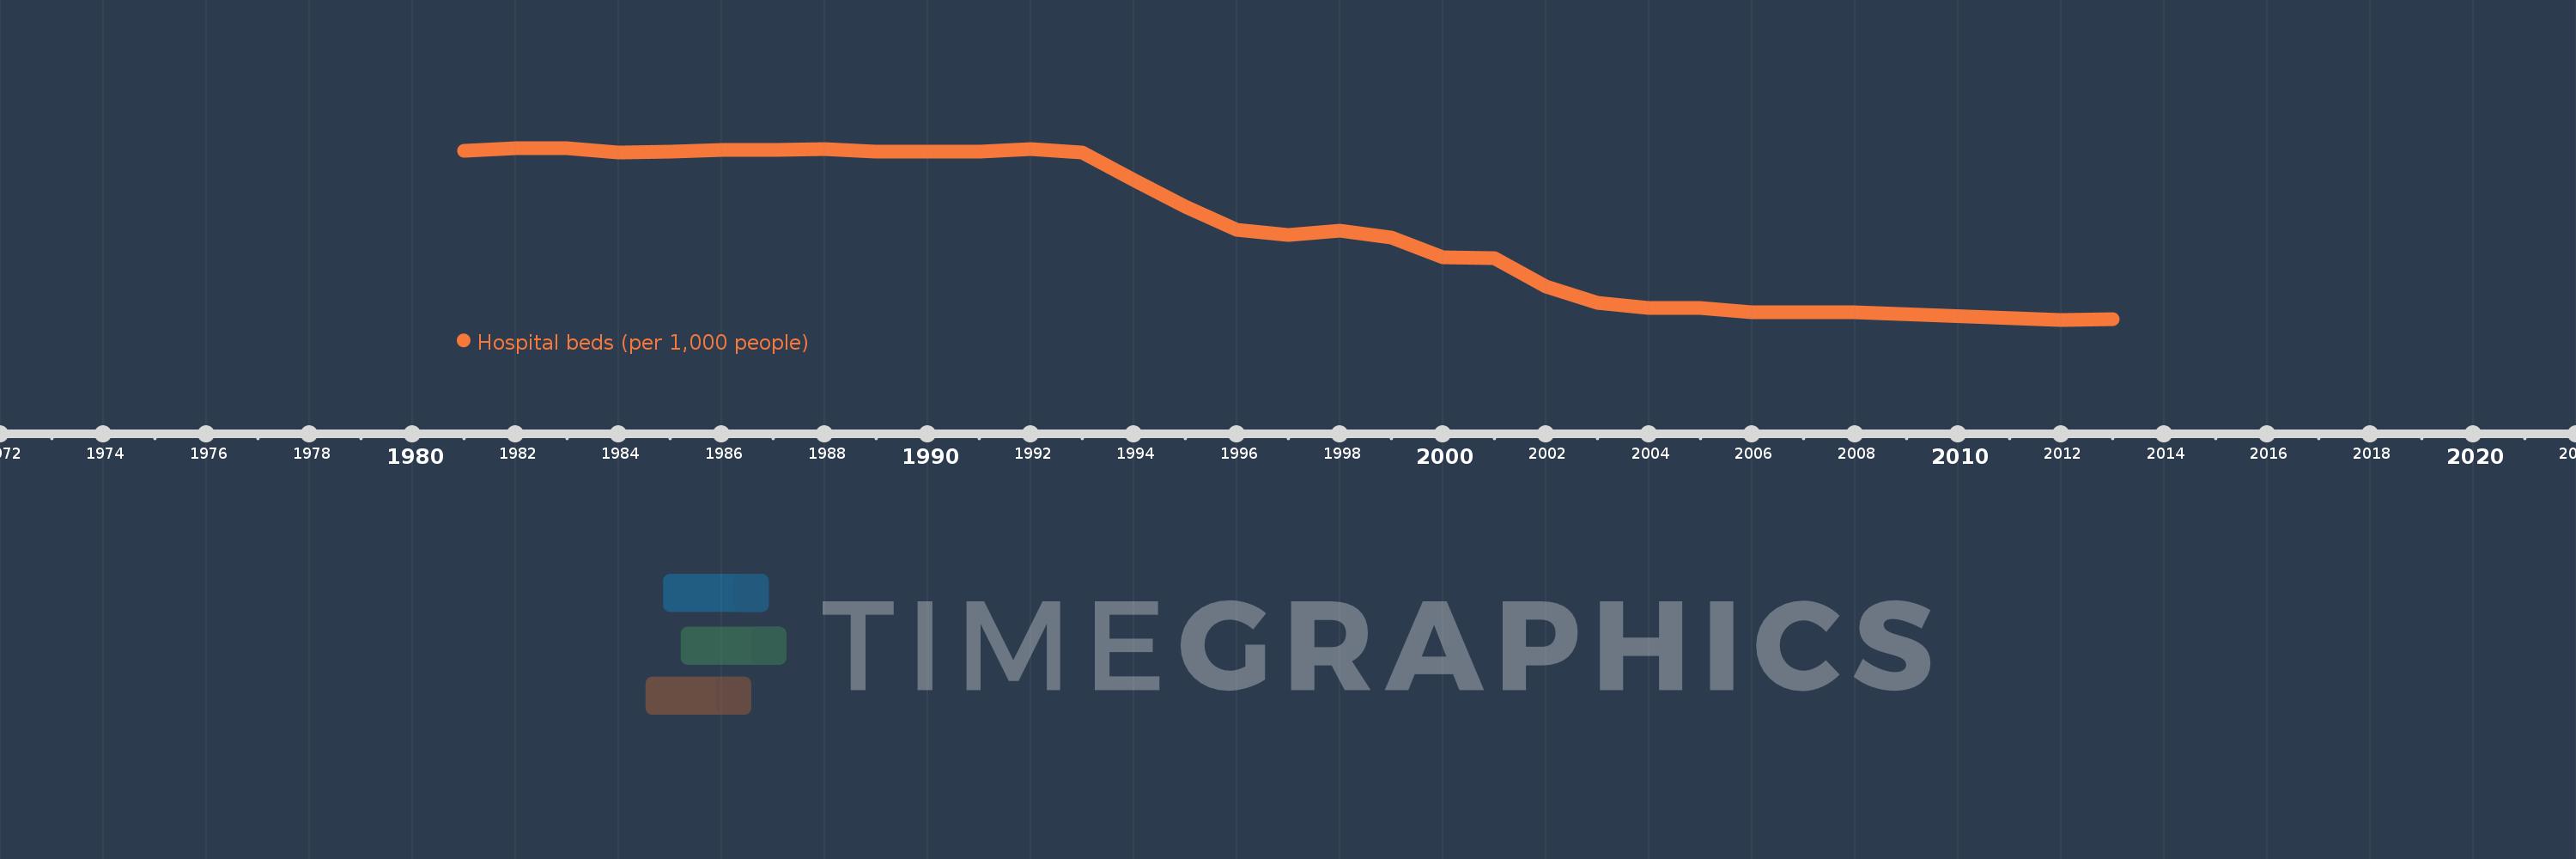
Hospital beds (per 1,000 people)
2013,2012,2008,2007,2006,2005,2004,2003,2002,2001,2000,1999,1998,1997,1996,1995,1994,1993,1992,1991,1990,1989,1988,1987,1986,1985,1984,1983,1982,1981
Estas estadísticas en otros países:
AfghanistanAlbaniaAlgeriaAndorraAngolaAntigua and BarbudaArab WorldArgentinaArmeniaAustraliaAustriaAzerbaijanBahamas, TheBahrainBangladeshBarbadosBelarusBelgiumBelizeBeninBermudaBhutanBoliviaBosnia and HerzegovinaBotswanaBrazilBrunei DarussalamBulgariaBurkina FasoBurundiCabo VerdeCambodiaCameroonCanadaCaribbean small statesCayman IslandsCentral African RepublicCentral Europe and the BalticsChadChannel IslandsChileChinaColombiaComorosCongo, Dem. Rep.Congo, Rep.Costa RicaCote d'IvoireCroatiaCubaCyprusCzech RepublicDenmarkDjiboutiDominicaDominican RepublicEarly-demographic dividendEast Asia & PacificEast Asia & Pacific (excluding high income)East Asia & Pacific (IDA & IBRD countries)EcuadorEgypt, Arab Rep.El SalvadorEquatorial GuineaEritreaEstoniaEthiopiaEuro areaEurope & Central AsiaEurope & Central Asia (excluding high income)Europe & Central Asia (IDA & IBRD countries)European UnionFijiFinlandFragile and conflict affected situationsFranceGabonGambia, TheGeorgiaGermanyGhanaGreeceGreenlandGrenadaGuatemalaGuineaGuinea-BissauGuyanaHaitiHeavily indebted poor countries (HIPC)High incomeHondurasHong Kong SAR, ChinaHungaryIBRD onlyIcelandIDA & IBRD totalIDA blendIDA onlyIDA totalIndiaIndonesiaIran, Islamic Rep.IraqIrelandIsraelItalyJamaicaJapanJordanKazakhstanKenyaKiribatiKorea, Dem. People’s Rep.Korea, Rep.KuwaitKyrgyz RepublicLao PDRLate-demographic dividendLatin America & Caribbean Latin America & Caribbean (excluding high income)Latin America & the Caribbean (IDA & IBRD countries)LatviaLeast developed countries: UN classificationLebanonLesothoLiberiaLibyaLithuaniaLow & middle incomeLow incomeLower middle incomeLuxembourgMacao SAR, ChinaMacedonia, FYRMadagascarMalawiMalaysiaMaldivesMaliMaltaMarshall IslandsMauritaniaMauritiusMexicoMicronesia, Fed. Sts.Middle East & North AfricaMiddle East & North Africa (excluding high income)Middle East & North Africa (IDA & IBRD countries)Middle incomeMoldovaMonacoMongoliaMontenegroMoroccoMozambiqueMyanmarNamibiaNauruNepalNetherlandsNew ZealandNicaraguaNigerNigeriaNorth AmericaNorwayOECD membersOmanPacific island small statesPakistanPalauPanamaPapua New GuineaParaguayPeruPhilippinesPolandPortugalPost-demographic dividendPre-demographic dividendPuerto RicoQatarRomaniaRussian FederationRwandaSamoaSan MarinoSao Tome and PrincipeSaudi ArabiaSenegalSerbiaSeychellesSierra LeoneSingaporeSlovak RepublicSloveniaSmall statesSolomon IslandsSomaliaSouth AfricaSouth AsiaSouth Asia (IDA & IBRD)SpainSri LankaSt. Kitts and NevisSt. LuciaSt. Vincent and the GrenadinesSub-Saharan Africa Sub-Saharan Africa (excluding high income)Sub-Saharan Africa (IDA & IBRD countries)SudanSurinameSwazilandSwedenSwitzerlandSyrian Arab RepublicTajikistanTanzaniaThailandTimor-LesteTogoTongaTrinidad and TobagoTunisiaTurkeyTurkmenistanTuvaluUgandaUkraineUnited Arab EmiratesUnited KingdomUnited StatesUpper middle incomeUruguayUzbekistanVanuatuVenezuela, RBVietnamVirgin Islands (U.S.)West Bank and GazaWorldYemen, Rep.ZambiaZimbabwe línea de tiempo (timeline):
En esta escala de tiempo se presenta un gráfico de 1981 y 2013 de Kyrgyz Republic. Los datos de 1980 están ausentes. El número de observaciones reales por fecha: 30.
Fuente (nombre):
Indicadores del desarrollo mundial
Fuente (organización):
Data are from the World Health Organization, supplemented by country data.
Categorías:
Health
Se ha actualizado:
23 abr 2017 año
Los indicadores de los cambios de valor en los últimos años
Mínimo:
4.79
1 ene 2012 año
Máximo:
12.118
1 ene 1982 año
A la fecha de observación
Valor
Cambio absoluto
El cambio con respecto al valor anterior
1 ene 1981 año
12.011
+12.011
0.0%
1 ene 1982 año
12.118
+0.107
0.89%
1 ene 1983 año
12.103
-0.015
-0.13%
1 ene 1984 año
11.936
-0.167
-1.38%
1 ene 1985 año
11.977
+0.041
0.34%
1 ene 1986 año
12.03
+0.053
0.45%
1 ene 1987 año
12.031
+0.0
0.0%
1 ene 1988 año
12.064
+0.033
0.28%
1 ene 1989 año
11.947
-0.117
-0.97%
1 ene 1990 año
11.972
+0.025
0.21%
1 ene 1991 año
11.977
+0.005
0.04%
1 ene 1992 año
12.058
+0.081
0.67%
1 ene 1993 año
11.932
-0.126
-1.04%
1 ene 1994 año
10.746
-1.186
-9.94%
1 ene 1995 año
9.605
-1.14
-10.61%
1 ene 1996 año
8.64
-0.965
-10.05%
1 ene 1997 año
8.41
-0.23
-2.66%
1 ene 1998 año
8.6
+0.19
2.26%
1 ene 1999 año
8.3
-0.3
-3.49%
1 ene 2000 año
7.47
-0.83
-10.0%
1 ene 2001 año
7.4
-0.07
-0.94%
1 ene 2002 año
6.2
-1.2
-16.22%
1 ene 2003 año
5.5
-0.7
-11.29%
1 ene 2004 año
5.3
-0.2
-3.64%
1 ene 2005 año
5.3
0.0
0.0%
1 ene 2006 año
5.1
-0.2
-3.77%
1 ene 2007 año
5.1
0.0
0.0%
1 ene 2008 año
5.1
0.0
0.0%
1 ene 2012 año
4.79
-0.31
-6.08%
1 ene 2013 año
4.8
+0.01
0.21%
Ranking de los países por los datos estadísticos actuales


Comentarios: