29
/es/
es
AIzaSyAYiBZKx7MnpbEhh9jyipgxe19OcubqV5w
April 1, 2024
171644
Kuwait
KWT
true
2
1
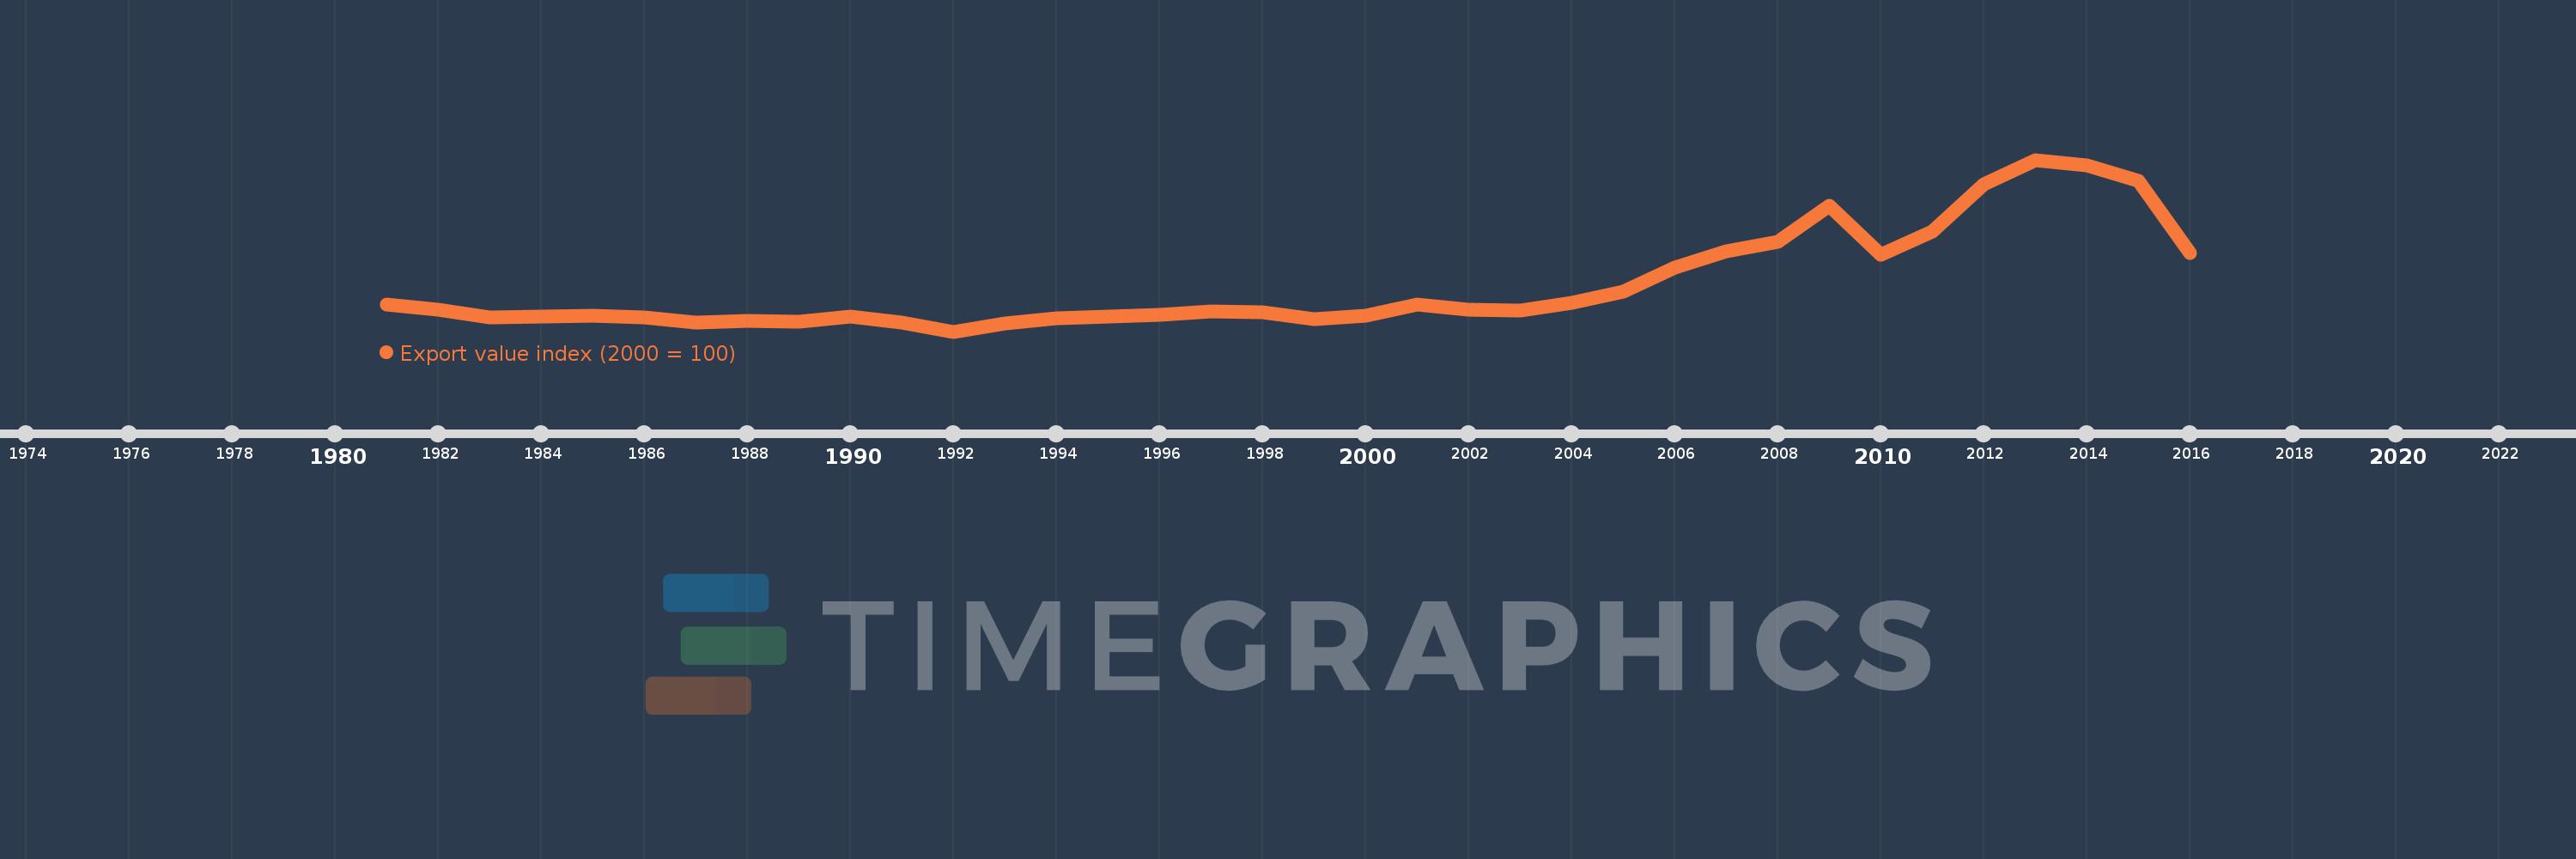
Export value index (2000 = 100)
2016,2015,2014,2013,2012,2011,2010,2009,2008,2007,2006,2005,2004,2003,2002,2001,2000,1999,1998,1997,1996,1995,1994,1993,1992,1991,1990,1989,1988,1987,1986,1985,1984,1983,1982,1981
Estas estadísticas en otros países:
AfghanistanAlbaniaAlgeriaAmerican SamoaAndorraAngolaAntigua and BarbudaArgentinaArmeniaArubaAustraliaAustriaAzerbaijanBahamas, TheBahrainBangladeshBarbadosBelarusBelgiumBelizeBeninBermudaBhutanBoliviaBosnia and HerzegovinaBotswanaBrazilBritish Virgin IslandsBrunei DarussalamBulgariaBurkina FasoBurundiCabo VerdeCambodiaCameroonCanadaCayman IslandsCentral African RepublicChadChileChinaColombiaComorosCongo, Dem. Rep.Congo, Rep.Costa RicaCote d'IvoireCroatiaCubaCuracaoCyprusCzech RepublicDenmarkDjiboutiDominicaDominican RepublicEcuadorEgypt, Arab Rep.El SalvadorEquatorial GuineaEritreaEstoniaEthiopiaFaroe IslandsFijiFinlandFranceFrench PolynesiaGabonGambia, TheGeorgiaGermanyGhanaGibraltarGreeceGreenlandGrenadaGuamGuatemalaGuineaGuinea-BissauGuyanaHaitiHondurasHong Kong SAR, ChinaHungaryIcelandIndiaIndonesiaIran, Islamic Rep.IraqIrelandIsraelItalyJamaicaJapanJordanKazakhstanKenyaKiribatiKorea, Dem. People’s Rep.Korea, Rep.KuwaitKyrgyz RepublicLao PDRLatviaLebanonLesothoLiberiaLibyaLithuaniaLuxembourgMacao SAR, ChinaMacedonia, FYRMadagascarMalawiMalaysiaMaldivesMaliMaltaMarshall IslandsMauritaniaMauritiusMexicoMicronesia, Fed. Sts.MoldovaMongoliaMoroccoMozambiqueMyanmarNamibiaNauruNepalNetherlandsNew CaledoniaNew ZealandNicaraguaNigerNigeriaNorthern Mariana IslandsNorwayOmanPakistanPalauPanamaPapua New GuineaParaguayPeruPhilippinesPolandPortugalQatarRomaniaRussian FederationRwandaSamoaSao Tome and PrincipeSaudi ArabiaSenegalSerbiaSeychellesSierra LeoneSingaporeSlovak RepublicSloveniaSolomon IslandsSomaliaSouth AfricaSpainSri LankaSt. Kitts and NevisSt. LuciaSt. Vincent and the GrenadinesSudanSurinameSwazilandSwedenSwitzerlandSyrian Arab RepublicTajikistanTanzaniaThailandTogoTongaTrinidad and TobagoTunisiaTurkeyTurkmenistanTurks and Caicos IslandsUgandaUkraineUnited Arab EmiratesUnited KingdomUnited StatesUruguayUzbekistanVanuatuVenezuela, RBVietnamWest Bank and GazaYemen, Rep.ZambiaZimbabwe línea de tiempo (timeline):
En esta escala de tiempo se presenta un gráfico de 1981 y 2016 de Kuwait. Los datos de 1980 están ausentes. El número de observaciones reales por fecha: 36.
Fuente (nombre):
Indicadores del desarrollo mundial
Fuente (organización):
United Nations Conference on Trade and Development, Handbook of Statistics and data files, and International Monetary Fund, International Financial Statistics.
Categorías:
Private Sector, Trade
Se ha actualizado:
23 abr 2017 año
Los indicadores de los cambios de valor en los últimos años
Mínimo:
5.598
1 ene 1992 año
Máximo:
611.812
1 ene 2013 año
A la fecha de observación
Valor
Cambio absoluto
El cambio con respecto al valor anterior
1 ene 1981 año
102.089
+102.089
0.0%
1 ene 1982 año
83.865
-18.224
-17.85%
1 ene 1983 año
56.395
-27.47
-32.75%
1 ene 1984 año
59.549
+3.154
5.59%
1 ene 1985 año
63.182
+3.632
6.1%
1 ene 1986 año
54.523
-8.659
-13.71%
1 ene 1987 año
37.307
-17.215
-31.57%
1 ene 1988 año
42.519
+5.212
13.97%
1 ene 1989 año
39.916
-2.603
-6.12%
1 ene 1990 año
59.045
+19.129
47.92%
1 ene 1991 año
36.232
-22.813
-38.64%
1 ene 1992 año
5.598
-30.634
-84.55%
1 ene 1993 año
33.814
+28.216
504.04%
1 ene 1994 año
52.717
+18.903
55.9%
1 ene 1995 año
57.934
+5.217
9.9%
1 ene 1996 año
65.78
+7.846
13.54%
1 ene 1997 año
76.605
+10.825
16.46%
1 ene 1998 año
73.184
-3.421
-4.47%
1 ene 1999 año
49.156
-24.028
-32.83%
1 ene 2000 año
62.585
+13.429
27.32%
1 ene 2001 año
100.0
+37.415
59.78%
1 ene 2002 año
83.366
-16.634
-16.63%
1 ene 2003 año
79.075
-4.291
-5.15%
1 ene 2004 año
106.39
+27.315
34.54%
1 ene 2005 año
147.144
+40.754
38.31%
1 ene 2006 año
230.853
+83.708
56.89%
1 ene 2007 año
288.208
+57.355
24.85%
1 ene 2008 año
322.552
+34.344
11.92%
1 ene 2009 año
449.974
+127.423
39.5%
1 ene 2010 año
277.877
-172.098
-38.25%
1 ene 2011 año
360.043
+82.166
29.57%
1 ene 2012 año
525.328
+165.285
45.91%
1 ene 2013 año
611.812
+86.485
16.46%
1 ene 2014 año
592.225
-19.587
-3.2%
1 ene 2015 año
536.71
-55.515
-9.37%
1 ene 2016 año
282.963
-253.748
-47.28%
Ranking de los países por los datos estadísticos actuales


Comentarios: