29
/es/
es
AIzaSyAYiBZKx7MnpbEhh9jyipgxe19OcubqV5w
April 1, 2024
170129
Korea, Rep.
KOR
true
2
1
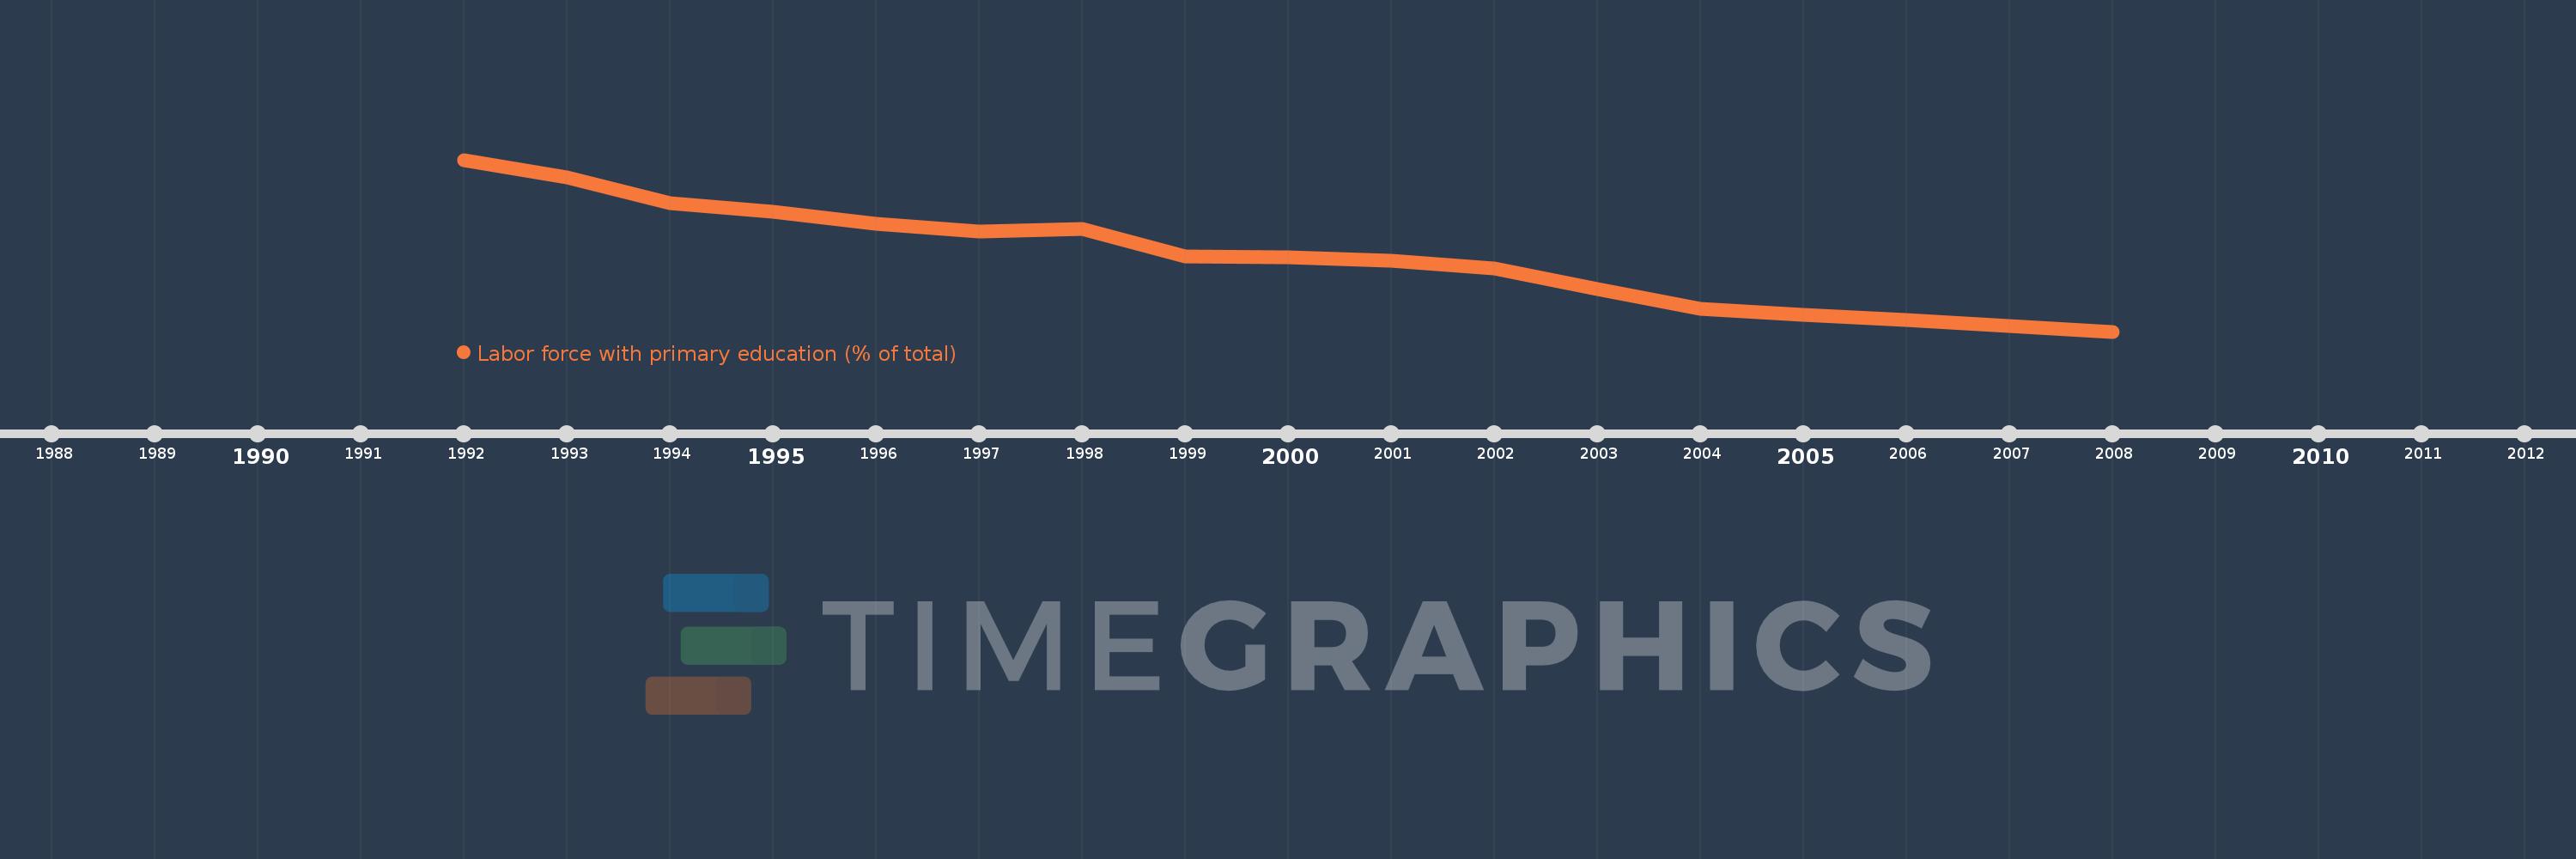
Labor force with primary education (% of total)
2008,2007,2006,2005,2004,2003,2002,2001,2000,1999,1998,1997,1996,1995,1994,1993,1992
Estas estadísticas en otros países:
línea de tiempo (timeline):
En esta escala de tiempo se presenta un gráfico de 1992 y 2008 de Korea, Rep.. Los datos de 1991 están ausentes. El número de observaciones reales por fecha: 17.
Fuente (nombre):
Indicadores del desarrollo mundial
Fuente (organización):
International Labour Organization, Key Indicators of the Labour Market database.
Categorías:
Education, Social Protection & Labor
Se ha actualizado:
23 abr 2017 año
Los indicadores de los cambios de valor en los últimos años
Mínimo:
23.0
1 ene 2008 año
Máximo:
46.0
1 ene 1992 año
A la fecha de observación
Valor
Cambio absoluto
El cambio con respecto al valor anterior
1 ene 1992 año
46.0
+46.0
0.0%
1 ene 1993 año
43.6
-2.4
-5.22%
1 ene 1994 año
40.2
-3.4
-7.8%
1 ene 1995 año
39.1
-1.1
-2.74%
1 ene 1996 año
37.4
-1.7
-4.35%
1 ene 1997 año
36.4
-1.0
-2.67%
1 ene 1998 año
36.7
+0.3
0.82%
1 ene 1999 año
33.1
-3.6
-9.81%
1 ene 2000 año
32.9
-0.2
-0.6%
1 ene 2001 año
32.5
-0.4
-1.22%
1 ene 2002 año
31.4
-1.1
-3.38%
1 ene 2003 año
28.7
-2.7
-8.6%
1 ene 2004 año
26.1
-2.6
-9.06%
1 ene 2005 año
25.2
-0.9
-3.45%
1 ene 2006 año
24.5
-0.7
-2.78%
1 ene 2007 año
23.8
-0.7
-2.86%
1 ene 2008 año
23.0
-0.8
-3.36%
Ranking de los países por los datos estadísticos actuales


Comentarios: