29
/es/
es
AIzaSyAYiBZKx7MnpbEhh9jyipgxe19OcubqV5w
April 1, 2024
169873
Korea, Rep.
KOR
true
2
1
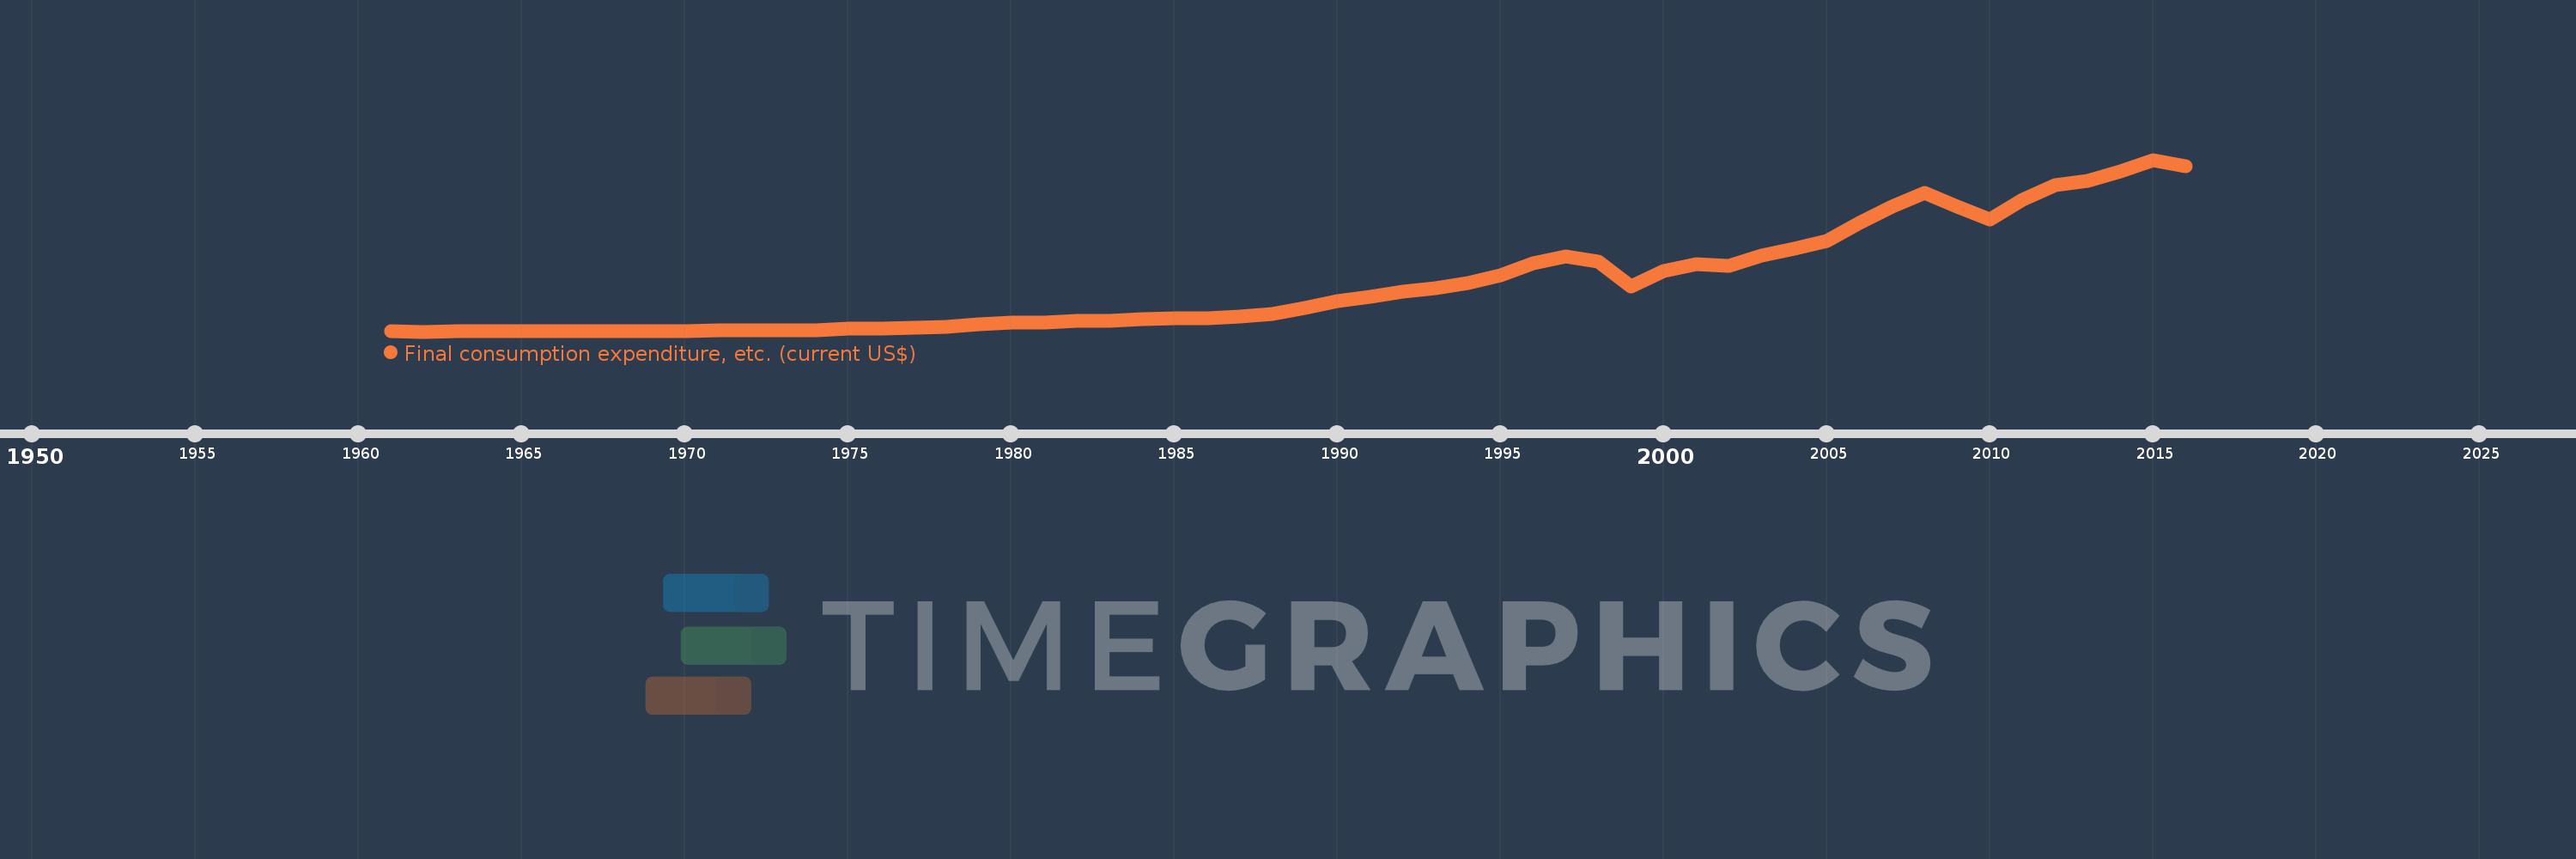
Final consumption expenditure, etc. (current US$)
2016,2015,2014,2013,2012,2011,2010,2009,2008,2007,2006,2005,2004,2003,2002,2001,2000,1999,1998,1997,1996,1995,1994,1993,1992,1991,1990,1989,1988,1987,1986,1985,1984,1983,1982,1981,1980,1979,1978,1977,1976,1975,1974,1973,1972,1971,1970,1969,1968,1967,1966,1965,1964,1963,1962,1961
Estas estadísticas en otros países:
AfghanistanAlbaniaAlgeriaAngolaAntigua and BarbudaArab WorldArgentinaArmeniaArubaAustraliaAustriaAzerbaijanBahamas, TheBahrainBangladeshBarbadosBelarusBelgiumBelizeBeninBermudaBhutanBoliviaBosnia and HerzegovinaBotswanaBrazilBrunei DarussalamBulgariaBurkina FasoBurundiCabo VerdeCambodiaCameroonCanadaCaribbean small statesCentral African RepublicCentral Europe and the BalticsChadChileChinaColombiaComorosCongo, Dem. Rep.Congo, Rep.Costa RicaCote d'IvoireCroatiaCubaCyprusCzech RepublicDenmarkDjiboutiDominicaDominican RepublicEarly-demographic dividendEast Asia & PacificEast Asia & Pacific (excluding high income)East Asia & Pacific (IDA & IBRD countries)EcuadorEgypt, Arab Rep.El SalvadorEquatorial GuineaEritreaEstoniaEthiopiaEuro areaEurope & Central AsiaEurope & Central Asia (excluding high income)Europe & Central Asia (IDA & IBRD countries)European UnionFaroe IslandsFijiFinlandFragile and conflict affected situationsFranceGabonGambia, TheGeorgiaGermanyGhanaGreeceGrenadaGuatemalaGuineaGuinea-BissauGuyanaHaitiHeavily indebted poor countries (HIPC)High incomeHondurasHong Kong SAR, ChinaHungaryIBRD onlyIcelandIDA & IBRD totalIDA blendIDA onlyIDA totalIndiaIndonesiaIran, Islamic Rep.IraqIrelandIsraelItalyJamaicaJapanJordanKazakhstanKenyaKiribatiKorea, Rep.KosovoKuwaitKyrgyz RepublicLao PDRLate-demographic dividendLatin America & Caribbean Latin America & Caribbean (excluding high income)Latin America & the Caribbean (IDA & IBRD countries)LatviaLeast developed countries: UN classificationLebanonLesothoLiberiaLibyaLithuaniaLow & middle incomeLow incomeLower middle incomeLuxembourgMacao SAR, ChinaMacedonia, FYRMadagascarMalawiMalaysiaMaldivesMaliMaltaMauritaniaMauritiusMexicoMicronesia, Fed. Sts.Middle East & North AfricaMiddle East & North Africa (excluding high income)Middle East & North Africa (IDA & IBRD countries)Middle incomeMoldovaMongoliaMontenegroMoroccoMozambiqueNamibiaNepalNetherlandsNew CaledoniaNew ZealandNicaraguaNigerNigeriaNorth AmericaNorwayOECD membersOmanOther small statesPakistanPanamaPapua New GuineaParaguayPeruPhilippinesPolandPortugalPost-demographic dividendPre-demographic dividendPuerto RicoQatarRomaniaRussian FederationRwandaSaudi ArabiaSenegalSerbiaSeychellesSierra LeoneSingaporeSlovak RepublicSloveniaSmall statesSolomon IslandsSouth AfricaSouth AsiaSouth Asia (IDA & IBRD)South SudanSpainSri LankaSt. Kitts and NevisSt. LuciaSt. Vincent and the GrenadinesSub-Saharan Africa Sub-Saharan Africa (excluding high income)Sub-Saharan Africa (IDA & IBRD countries)SudanSurinameSwazilandSwedenSwitzerlandSyrian Arab RepublicTajikistanTanzaniaThailandTimor-LesteTogoTongaTrinidad and TobagoTunisiaTurkeyTurkmenistanUgandaUkraineUnited Arab EmiratesUnited KingdomUnited StatesUpper middle incomeUruguayUzbekistanVanuatuVenezuela, RBVietnamWest Bank and GazaWorldYemen, Rep.ZambiaZimbabwe línea de tiempo (timeline):
En esta escala de tiempo se presenta un gráfico de 1961 y 2016 de Korea, Rep.. Los datos de 1960 están ausentes. El número de observaciones reales por fecha: 56.
Fuente (nombre):
Indicadores del desarrollo mundial
Fuente (organización):
World Bank national accounts data, and OECD National Accounts data files.
Categorías:
Economy & Growth
Se ha actualizado:
23 abr 2017 año
Los indicadores de los cambios de valor en los últimos años
Mínimo:
2.274 bn
1 ene 1962 año
Máximo:
923.99 bn
1 ene 2015 año
A la fecha de observación
Valor
Cambio absoluto
El cambio con respecto al valor anterior
1 ene 1961 año
3.814 bn
+3.814 bn
0.0%
1 ene 1962 año
2.274 bn
-1.54 bn
-40.37%
1 ene 1963 año
2.693 bn
+419.273 millones
18.44%
1 ene 1964 año
3.595 bn
+901.57 millones
33.48%
1 ene 1965 año
3.145 bn
-449.363 millones
-12.5%
1 ene 1966 año
2.776 bn
-369.871 millones
-11.76%
1 ene 1967 año
3.333 bn
+557.736 millones
20.09%
1 ene 1968 año
4.136 bn
+802.362 millones
24.07%
1 ene 1969 año
5.123 bn
+987.549 millones
23.88%
1 ene 1970 año
6.148 bn
+1.024 bn
20.0%
1 ene 1971 año
8.06 bn
+1.913 bn
31.11%
1 ene 1972 año
8.947 bn
+887.151 millones
11.01%
1 ene 1973 año
9.559 bn
+611.735 millones
6.84%
1 ene 1974 año
11.466 bn
+1.907 bn
19.95%
1 ene 1975 año
16.421 bn
+4.955 bn
43.22%
1 ene 1976 año
18.473 bn
+2.052 bn
12.5%
1 ene 1977 año
24.067 bn
+5.594 bn
30.28%
1 ene 1978 año
29.693 bn
+5.625 bn
23.37%
1 ene 1979 año
39.271 bn
+9.578 bn
32.26%
1 ene 1980 año
50.695 bn
+11.424 bn
29.09%
1 ene 1981 año
52.54 bn
+1.845 bn
3.64%
1 ene 1982 año
58.964 bn
+6.424 bn
12.23%
1 ene 1983 año
61.708 bn
+2.744 bn
4.65%
1 ene 1984 año
66.952 bn
+5.244 bn
8.5%
1 ene 1985 año
72.02 bn
+5.068 bn
7.57%
1 ene 1986 año
74.206 bn
+2.186 bn
3.04%
1 ene 1987 año
81.728 bn
+7.522 bn
10.14%
1 ene 1988 año
98.665 bn
+16.937 bn
20.72%
1 ene 1989 año
130.105 bn
+31.44 bn
31.87%
1 ene 1990 año
165.824 bn
+35.719 bn
27.45%
1 ene 1991 año
188.641 bn
+22.817 bn
13.76%
1 ene 1992 año
218.063 bn
+29.422 bn
15.6%
1 ene 1993 año
236.919 bn
+18.856 bn
8.65%
1 ene 1994 año
261.15 bn
+24.231 bn
10.23%
1 ene 1995 año
305.368 bn
+44.218 bn
16.93%
1 ene 1996 año
370.198 bn
+64.83 bn
21.23%
1 ene 1997 año
406.017 bn
+35.819 bn
9.68%
1 ene 1998 año
377.889 bn
-28.128 bn
-6.93%
1 ene 1999 año
245.679 bn
-132.21 bn
-34.99%
1 ene 2000 año
326.818 bn
+81.139 bn
33.03%
1 ene 2001 año
364.993 bn
+38.174 bn
11.68%
1 ene 2002 año
356.54 bn
-8.452 bn
-2.32%
1 ene 2003 año
411.456 bn
+54.916 bn
15.4%
1 ene 2004 año
448.965 bn
+37.509 bn
9.12%
1 ene 2005 año
489.937 bn
+40.972 bn
9.13%
1 ene 2006 año
587.399 bn
+97.462 bn
19.89%
1 ene 2007 año
673.029 bn
+85.63 bn
14.58%
1 ene 2008 año
744.27 bn
+71.241 bn
10.59%
1 ene 2009 año
671.409 bn
-72.862 bn
-9.79%
1 ene 2010 año
602.921 bn
-68.488 bn
-10.2%
1 ene 2011 año
709.151 bn
+106.23 bn
17.62%
1 ene 2012 año
788.17 bn
+79.02 bn
11.14%
1 ene 2013 año
809.553 bn
+21.383 bn
2.71%
1 ene 2014 año
860.634 bn
+51.081 bn
6.31%
1 ene 2015 año
923.99 bn
+63.356 bn
7.36%
1 ene 2016 año
889.449 bn
-34.54 bn
-3.74%
Ranking de los países por los datos estadísticos actuales


Comentarios: