29
/es/
es
AIzaSyAYiBZKx7MnpbEhh9jyipgxe19OcubqV5w
April 1, 2024
166391
Kazakhstan
KAZ
true
2
1
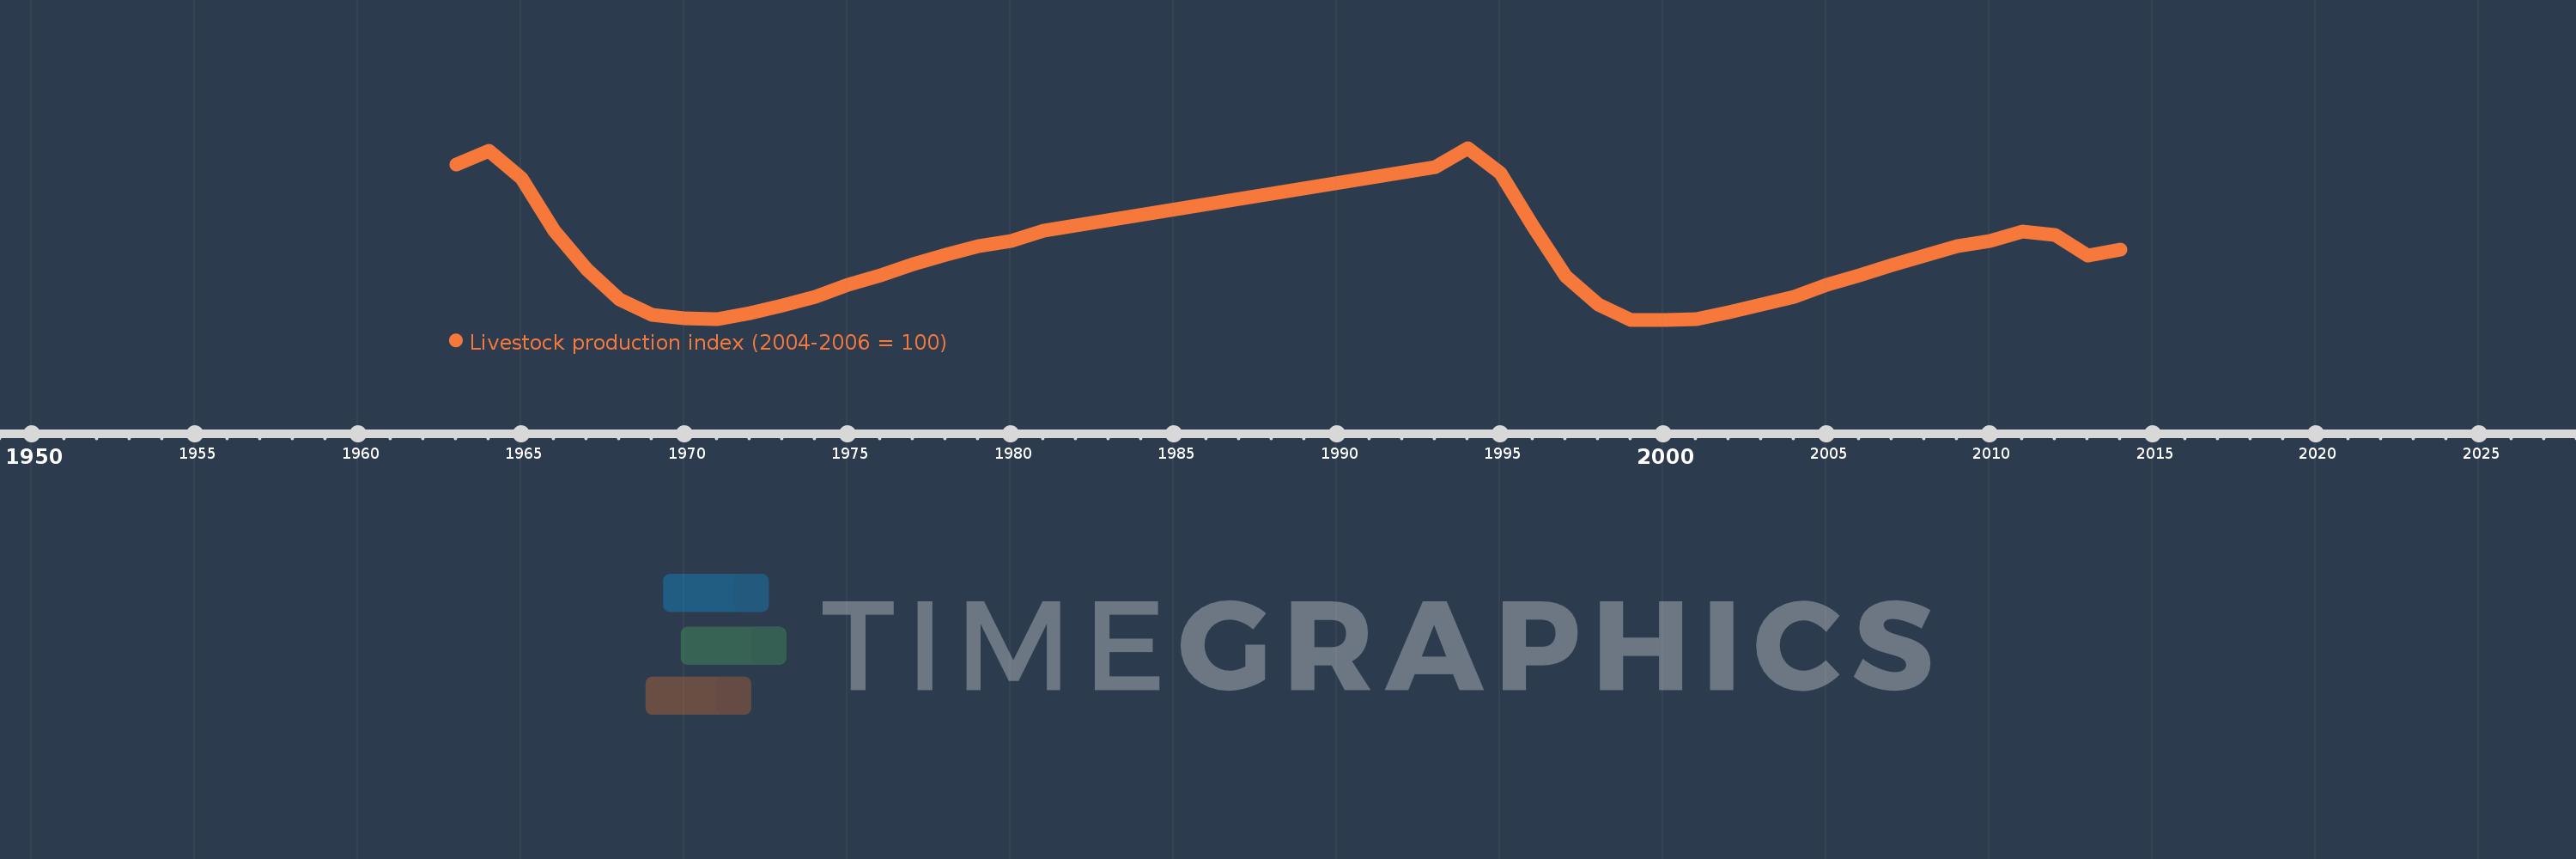
Livestock production index (2004-2006 = 100)
2014,2013,2012,2011,2010,2009,2008,2007,2006,2005,2004,2003,2002,2001,2000,1999,1998,1997,1996,1995,1994,1993,1981,1980,1979,1978,1977,1976,1975,1974,1973,1972,1971,1970,1969,1968,1967,1966,1965,1964,1963
Estas estadísticas en otros países:
AfghanistanAlbaniaAlgeriaAmerican SamoaAngolaAntigua and BarbudaArab WorldArgentinaArmeniaAustraliaAustriaAzerbaijanBahamas, TheBahrainBangladeshBarbadosBelarusBelgiumBelizeBeninBermudaBhutanBoliviaBosnia and HerzegovinaBotswanaBrazilBritish Virgin IslandsBrunei DarussalamBulgariaBurkina FasoBurundiCabo VerdeCambodiaCameroonCanadaCaribbean small statesCayman IslandsCentral African RepublicCentral Europe and the BalticsChadChileChinaColombiaComorosCongo, Dem. Rep.Congo, Rep.Costa RicaCote d'IvoireCroatiaCubaCyprusCzech RepublicDenmarkDjiboutiDominicaDominican RepublicEarly-demographic dividendEast Asia & PacificEast Asia & Pacific (excluding high income)East Asia & Pacific (IDA & IBRD countries)EcuadorEgypt, Arab Rep.El SalvadorEquatorial GuineaEritreaEstoniaEthiopiaEuro areaEurope & Central AsiaEurope & Central Asia (excluding high income)Europe & Central Asia (IDA & IBRD countries)European UnionFaroe IslandsFijiFinlandFragile and conflict affected situationsFranceFrench PolynesiaGabonGambia, TheGeorgiaGermanyGhanaGreeceGreenlandGrenadaGuamGuatemalaGuineaGuinea-BissauGuyanaHaitiHeavily indebted poor countries (HIPC)High incomeHondurasHong Kong SAR, ChinaHungaryIBRD onlyIcelandIDA & IBRD totalIDA blendIDA onlyIDA totalIndiaIndonesiaIran, Islamic Rep.IraqIrelandIsraelItalyJamaicaJapanJordanKazakhstanKenyaKiribatiKorea, Dem. People’s Rep.Korea, Rep.KuwaitKyrgyz RepublicLao PDRLate-demographic dividendLatin America & Caribbean Latin America & Caribbean (excluding high income)Latin America & the Caribbean (IDA & IBRD countries)LatviaLeast developed countries: UN classificationLebanonLesothoLiberiaLibyaLiechtensteinLithuaniaLow & middle incomeLow incomeLower middle incomeLuxembourgMacao SAR, ChinaMacedonia, FYRMadagascarMalawiMalaysiaMaldivesMaliMaltaMauritaniaMauritiusMexicoMicronesia, Fed. Sts.Middle East & North AfricaMiddle East & North Africa (excluding high income)Middle East & North Africa (IDA & IBRD countries)Middle incomeMoldovaMongoliaMontenegroMoroccoMozambiqueMyanmarNamibiaNauruNepalNetherlandsNew CaledoniaNew ZealandNicaraguaNigerNigeriaNorth AmericaNorwayOECD membersOmanOther small statesPacific island small statesPakistanPanamaPapua New GuineaParaguayPeruPhilippinesPolandPortugalPost-demographic dividendPre-demographic dividendPuerto RicoQatarRomaniaRussian FederationRwandaSamoaSao Tome and PrincipeSaudi ArabiaSenegalSerbiaSeychellesSierra LeoneSingaporeSlovak RepublicSloveniaSmall statesSolomon IslandsSomaliaSouth AfricaSouth AsiaSouth Asia (IDA & IBRD)SpainSri LankaSt. Kitts and NevisSt. LuciaSt. Vincent and the GrenadinesSub-Saharan Africa Sub-Saharan Africa (excluding high income)Sub-Saharan Africa (IDA & IBRD countries)SudanSurinameSwazilandSwedenSwitzerlandSyrian Arab RepublicTajikistanTanzaniaThailandTimor-LesteTogoTongaTrinidad and TobagoTunisiaTurkeyTurkmenistanTuvaluUgandaUkraineUnited Arab EmiratesUnited KingdomUnited StatesUpper middle incomeUruguayUzbekistanVanuatuVenezuela, RBVietnamVirgin Islands (U.S.)West Bank and GazaWorldYemen, Rep.ZambiaZimbabwe línea de tiempo (timeline):
En esta escala de tiempo se presenta un gráfico de 1963 y 2014 de Kazakhstan. Los datos de 1962 están ausentes. El número de observaciones reales por fecha: 41.
Fuente (nombre):
Indicadores del desarrollo mundial
Fuente (organización):
Food and Agriculture Organization, electronic files and web site.
Categorías:
Agriculture & Rural Development
Se ha actualizado:
23 abr 2017 año
Los indicadores de los cambios de valor en los últimos años
Mínimo:
80.57
1 ene 1999 año
Máximo:
154.71
1 ene 1994 año
A la fecha de observación
Valor
Cambio absoluto
El cambio con respecto al valor anterior
1 ene 1963 año
147.6
+147.6
0.0%
1 ene 1964 año
153.6
+6.0
4.07%
1 ene 1965 año
141.8
-11.8
-7.68%
1 ene 1966 año
119.0
-22.8
-16.08%
1 ene 1967 año
102.2
-16.8
-14.12%
1 ene 1968 año
89.4
-12.8
-12.52%
1 ene 1969 año
82.5
-6.9
-7.72%
1 ene 1970 año
81.1
-1.4
-1.7%
1 ene 1971 año
80.81
-0.29
-0.36%
1 ene 1972 año
83.49
+2.68
3.32%
1 ene 1973 año
86.68
+3.19
3.82%
1 ene 1974 año
90.4
+3.72
4.29%
1 ene 1975 año
95.63
+5.23
5.79%
1 ene 1976 año
99.83
+4.2
4.39%
1 ene 1977 año
104.55
+4.72
4.73%
1 ene 1978 año
108.68
+4.13
3.95%
1 ene 1979 año
112.47
+3.79
3.49%
1 ene 1980 año
114.6
+2.13
1.89%
1 ene 1981 año
118.98
+4.38
3.82%
1 ene 1993 año
146.41
+27.43
23.05%
1 ene 1994 año
154.71
+8.3
5.67%
1 ene 1995 año
143.81
-10.9
-7.05%
1 ene 1996 año
120.8
-23.01
-16.0%
1 ene 1997 año
99.35
-21.45
-17.76%
1 ene 1998 año
87.04
-12.31
-12.39%
1 ene 1999 año
80.57
-6.47
-7.43%
1 ene 2000 año
80.59
+0.02
0.02%
1 ene 2001 año
80.86
+0.27
0.34%
1 ene 2002 año
83.63
+2.77
3.43%
1 ene 2003 año
87.03
+3.4
4.07%
1 ene 2004 año
90.63
+3.6
4.14%
1 ene 2005 año
95.78
+5.15
5.68%
1 ene 2006 año
99.86
+4.08
4.26%
1 ene 2007 año
104.36
+4.5
4.51%
1 ene 2008 año
108.34
+3.98
3.81%
1 ene 2009 año
112.3
+3.96
3.66%
1 ene 2010 año
114.68
+2.38
2.12%
1 ene 2011 año
118.6
+3.92
3.42%
1 ene 2012 año
117.13
-1.47
-1.24%
1 ene 2013 año
108.38
-8.75
-7.47%
1 ene 2014 año
110.98
+2.6
2.4%
Ranking de los países por los datos estadísticos actuales


Comentarios: