29
/es/
es
AIzaSyAYiBZKx7MnpbEhh9jyipgxe19OcubqV5w
April 1, 2024
165097
Jordan
JOR
true
2
1
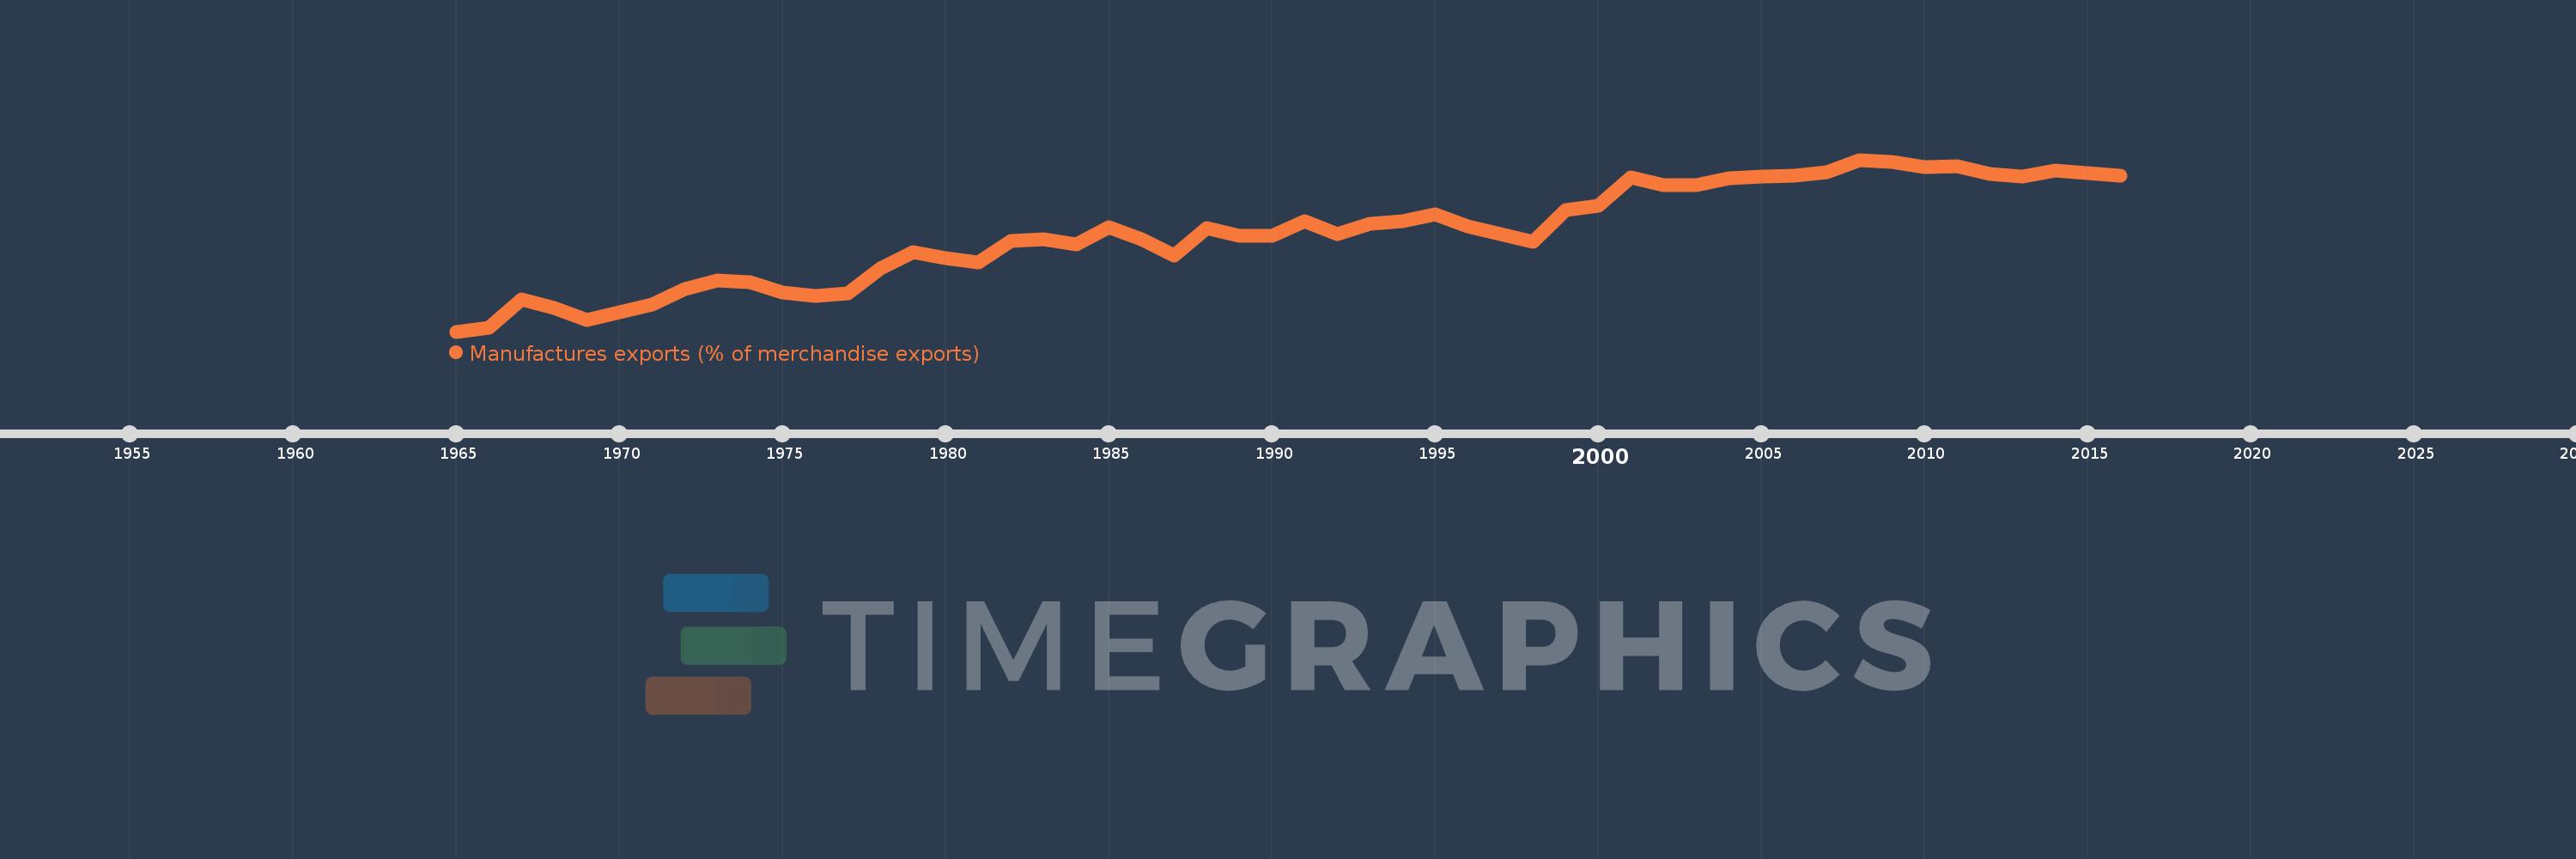
Manufactures exports (% of merchandise exports)
2016,2015,2014,2013,2012,2011,2010,2009,2008,2007,2006,2005,2004,2003,2002,2001,2000,1999,1998,1996,1995,1994,1993,1992,1991,1990,1989,1988,1987,1986,1985,1984,1983,1982,1981,1980,1979,1978,1977,1976,1975,1974,1973,1972,1971,1970,1969,1968,1967,1966,1965
Estas estadísticas en otros países:
AfghanistanAlbaniaAlgeriaAndorraAngolaAntigua and BarbudaArab WorldArgentinaArmeniaArubaAustraliaAustriaAzerbaijanBahamas, TheBahrainBangladeshBarbadosBelarusBelgiumBelizeBeninBermudaBhutanBoliviaBosnia and HerzegovinaBotswanaBrazilBrunei DarussalamBulgariaBurkina FasoBurundiCabo VerdeCambodiaCameroonCanadaCaribbean small statesCayman IslandsCentral African RepublicCentral Europe and the BalticsChadChileChinaColombiaComorosCongo, Dem. Rep.Congo, Rep.Costa RicaCote d'IvoireCroatiaCubaCyprusCzech RepublicDenmarkDjiboutiDominicaDominican RepublicEarly-demographic dividendEast Asia & PacificEast Asia & Pacific (excluding high income)East Asia & Pacific (IDA & IBRD countries)EcuadorEgypt, Arab Rep.El SalvadorEquatorial GuineaEritreaEstoniaEthiopiaEuro areaEurope & Central AsiaEurope & Central Asia (excluding high income)Europe & Central Asia (IDA & IBRD countries)European UnionFaroe IslandsFijiFinlandFragile and conflict affected situationsFranceFrench PolynesiaGabonGambia, TheGeorgiaGermanyGhanaGreeceGreenlandGrenadaGuatemalaGuineaGuinea-BissauGuyanaHaitiHeavily indebted poor countries (HIPC)High incomeHondurasHong Kong SAR, ChinaHungaryIBRD onlyIcelandIDA & IBRD totalIDA blendIDA onlyIDA totalIndiaIndonesiaIran, Islamic Rep.IraqIrelandIsraelItalyJamaicaJapanJordanKazakhstanKenyaKiribatiKorea, Rep.KuwaitKyrgyz RepublicLao PDRLate-demographic dividendLatin America & Caribbean Latin America & Caribbean (excluding high income)Latin America & the Caribbean (IDA & IBRD countries)LatviaLeast developed countries: UN classificationLebanonLesothoLiberiaLibyaLithuaniaLow & middle incomeLower middle incomeLuxembourgMacao SAR, ChinaMacedonia, FYRMadagascarMalawiMalaysiaMaldivesMaliMaltaMauritaniaMauritiusMexicoMiddle East & North AfricaMiddle East & North Africa (excluding high income)Middle East & North Africa (IDA & IBRD countries)Middle incomeMoldovaMongoliaMoroccoMozambiqueMyanmarNamibiaNepalNetherlandsNew CaledoniaNew ZealandNicaraguaNigerNigeriaNorth AmericaNorwayOECD membersOmanOther small statesPacific island small statesPakistanPalauPanamaPapua New GuineaParaguayPeruPhilippinesPolandPortugalPost-demographic dividendPre-demographic dividendQatarRomaniaRussian FederationRwandaSamoaSao Tome and PrincipeSaudi ArabiaSenegalSerbiaSeychellesSierra LeoneSingaporeSlovak RepublicSloveniaSmall statesSolomon IslandsSomaliaSouth AfricaSouth AsiaSouth Asia (IDA & IBRD)SpainSri LankaSt. Kitts and NevisSt. LuciaSt. Vincent and the GrenadinesSub-Saharan Africa Sub-Saharan Africa (excluding high income)Sub-Saharan Africa (IDA & IBRD countries)SudanSurinameSwazilandSwedenSwitzerlandSyrian Arab RepublicTajikistanTanzaniaThailandTimor-LesteTogoTongaTrinidad and TobagoTunisiaTurkeyTurkmenistanTurks and Caicos IslandsTuvaluUgandaUkraineUnited Arab EmiratesUnited KingdomUnited StatesUpper middle incomeUruguayVanuatuVenezuela, RBVietnamVirgin Islands (U.S.)WorldYemen, Rep.ZambiaZimbabwe línea de tiempo (timeline):
En esta escala de tiempo se presenta un gráfico de 1965 y 2016 de Jordan. Los datos de 1964 están ausentes. El número de observaciones reales por fecha: 51.
Fuente (nombre):
Indicadores del desarrollo mundial
Fuente (organización):
World Bank staff estimates from the Comtrade database maintained by the United Nations Statistics Division.
Categorías:
Private Sector, Trade
Se ha actualizado:
23 abr 2017 año
Los indicadores de los cambios de valor en los últimos años
Mínimo:
5.102
1 ene 1965 año
Máximo:
76.325
1 ene 2008 año
A la fecha de observación
Valor
Cambio absoluto
El cambio con respecto al valor anterior
1 ene 1965 año
5.102
+5.102
0.0%
1 ene 1966 año
6.579
+1.477
28.94%
1 ene 1967 año
18.297
+11.718
178.11%
1 ene 1968 año
14.909
-3.388
-18.52%
1 ene 1969 año
9.815
-5.094
-34.17%
1 ene 1970 año
13.012
+3.197
32.57%
1 ene 1971 año
16.178
+3.166
24.33%
1 ene 1972 año
22.788
+6.61
40.86%
1 ene 1973 año
26.428
+3.64
15.97%
1 ene 1974 año
25.728
-0.699
-2.65%
1 ene 1975 año
21.153
-4.576
-17.78%
1 ene 1976 año
19.953
-1.2
-5.67%
1 ene 1977 año
21.023
+1.07
5.36%
1 ene 1978 año
31.15
+10.127
48.17%
1 ene 1979 año
38.063
+6.914
22.2%
1 ene 1980 año
35.475
-2.589
-6.8%
1 ene 1981 año
33.805
-1.67
-4.71%
1 ene 1982 año
42.601
+8.796
26.02%
1 ene 1983 año
43.367
+0.767
1.8%
1 ene 1984 año
41.111
-2.256
-5.2%
1 ene 1985 año
48.35
+7.239
17.61%
1 ene 1986 año
43.289
-5.06
-10.47%
1 ene 1987 año
36.447
-6.843
-15.81%
1 ene 1988 año
47.958
+11.511
31.58%
1 ene 1989 año
44.778
-3.18
-6.63%
1 ene 1990 año
44.832
+0.054
0.12%
1 ene 1991 año
50.794
+5.962
13.3%
1 ene 1992 año
45.669
-5.125
-10.09%
1 ene 1993 año
49.746
+4.077
8.93%
1 ene 1994 año
50.937
+1.192
2.4%
1 ene 1995 año
53.806
+2.869
5.63%
1 ene 1996 año
48.68
-5.126
-9.53%
1 ene 1998 año
42.48
-6.2
-12.74%
1 ene 1999 año
55.545
+13.065
30.76%
1 ene 2000 año
57.352
+1.807
3.25%
1 ene 2001 año
68.965
+11.613
20.25%
1 ene 2002 año
65.952
-3.014
-4.37%
1 ene 2003 año
65.658
-0.293
-0.44%
1 ene 2004 año
68.808
+3.15
4.8%
1 ene 2005 año
69.362
+0.553
0.8%
1 ene 2006 año
69.734
+0.373
0.54%
1 ene 2007 año
71.191
+1.457
2.09%
1 ene 2008 año
76.325
+5.134
7.21%
1 ene 2009 año
75.371
-0.954
-1.25%
1 ene 2010 año
73.291
-2.08
-2.76%
1 ene 2011 año
73.563
+0.272
0.37%
1 ene 2012 año
70.411
-3.152
-4.29%
1 ene 2013 año
69.557
-0.854
-1.21%
1 ene 2014 año
71.924
+2.367
3.4%
1 ene 2015 año
70.905
-1.019
-1.42%
1 ene 2016 año
69.634
-1.27
-1.79%
Ranking de los países por los datos estadísticos actuales


Comentarios: