29
/es/
es
AIzaSyAYiBZKx7MnpbEhh9jyipgxe19OcubqV5w
April 1, 2024
162819
Jamaica
JAM
true
2
1
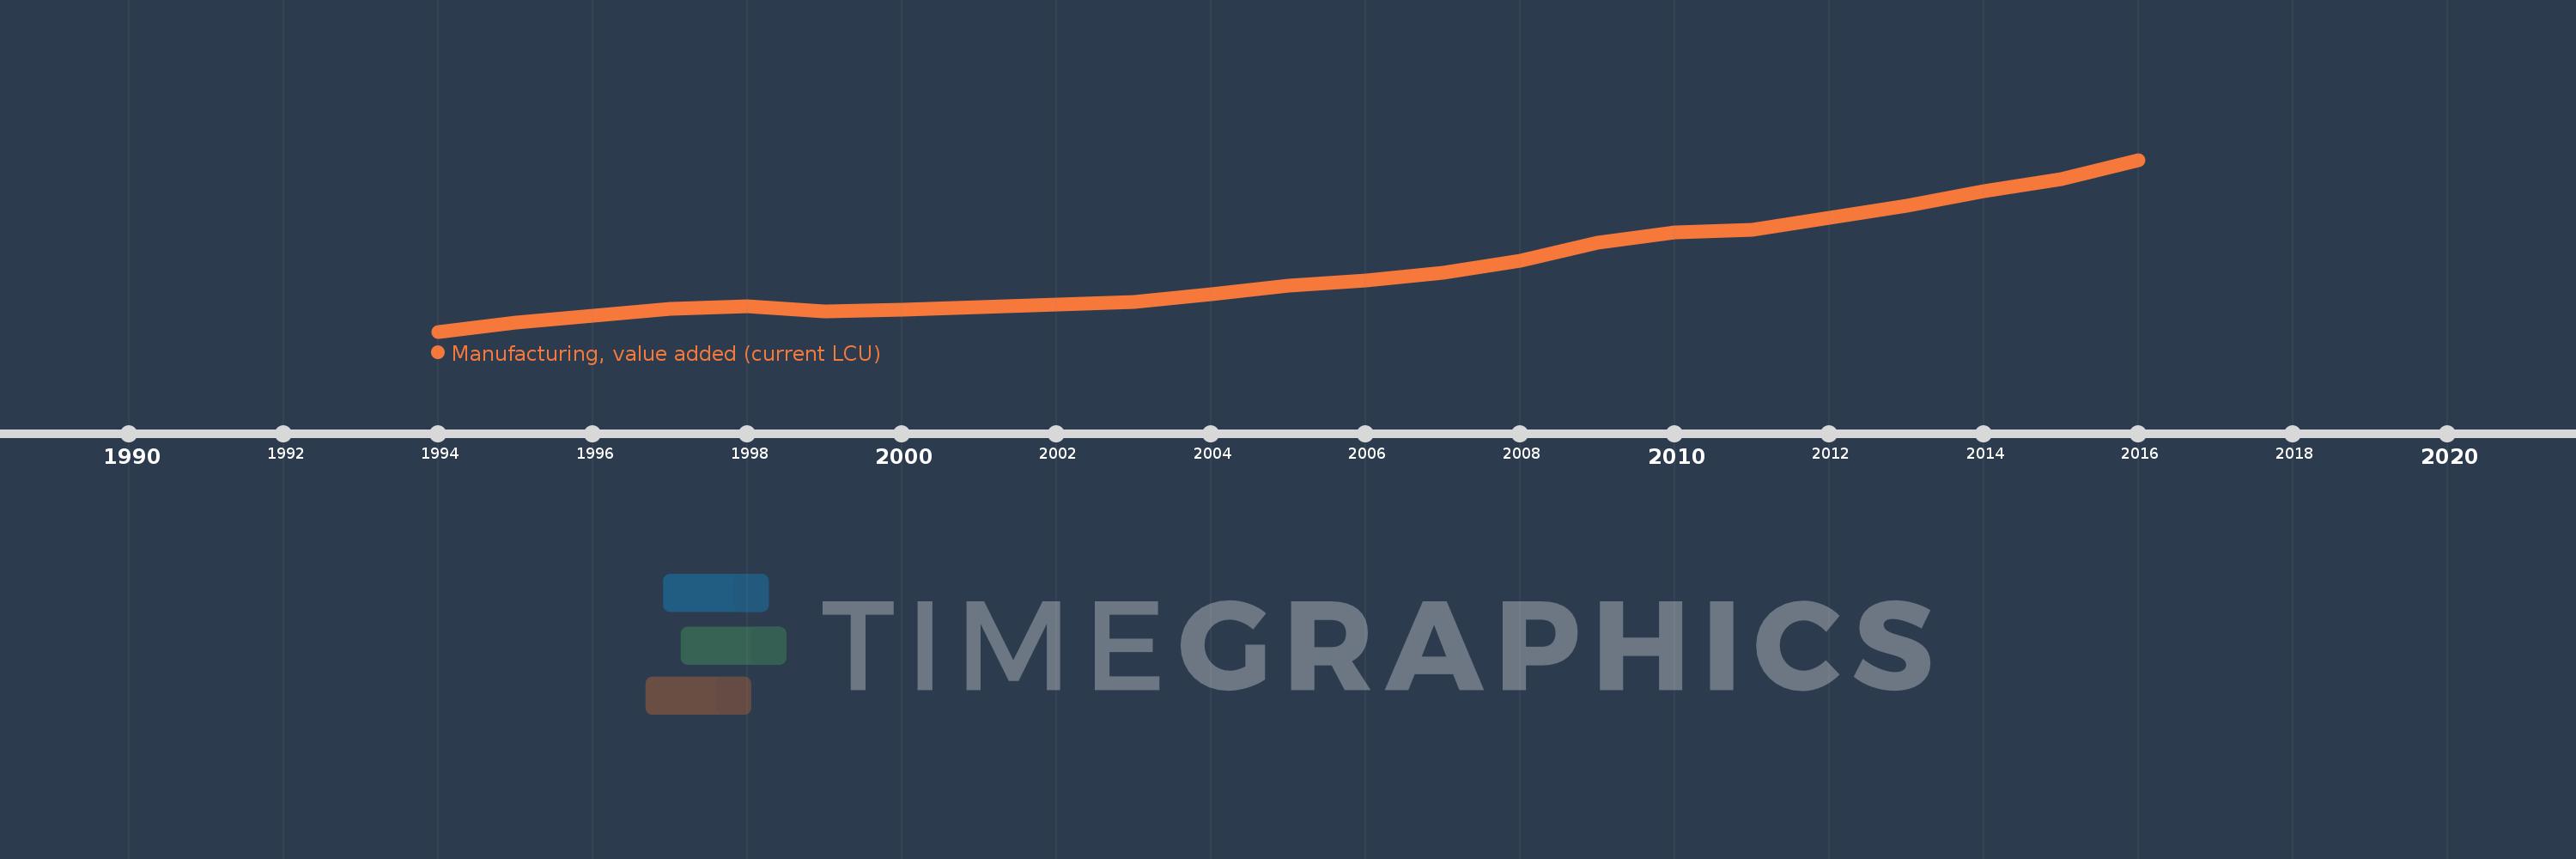
Manufacturing, value added (current LCU)
2016,2015,2014,2013,2012,2011,2010,2009,2008,2007,2006,2005,2004,2003,2002,2001,2000,1999,1998,1997,1996,1995,1994
Estas estadísticas en otros países:
AfghanistanAlbaniaAlgeriaAndorraAngolaAntigua and BarbudaArgentinaArmeniaArubaAustraliaAustriaAzerbaijanBahamas, TheBahrainBangladeshBarbadosBelarusBelgiumBelizeBeninBermudaBhutanBoliviaBosnia and HerzegovinaBotswanaBrazilBrunei DarussalamBurkina FasoBurundiCabo VerdeCambodiaCameroonCanadaCayman IslandsCentral African RepublicChadChileChinaColombiaComorosCongo, Dem. Rep.Congo, Rep.Costa RicaCote d'IvoireCroatiaCubaCyprusCzech RepublicDenmarkDjiboutiDominicaDominican RepublicEcuadorEgypt, Arab Rep.El SalvadorEquatorial GuineaEritreaEstoniaEthiopiaFaroe IslandsFijiFinlandFranceGabonGambia, TheGeorgiaGermanyGhanaGreeceGrenadaGuatemalaGuineaGuinea-BissauGuyanaHondurasHong Kong SAR, ChinaHungaryIcelandIndiaIndonesiaIran, Islamic Rep.IraqIrelandItalyJamaicaJapanJordanKazakhstanKenyaKiribatiKorea, Rep.KosovoKuwaitKyrgyz RepublicLao PDRLatviaLebanonLesothoLiberiaLibyaLithuaniaLuxembourgMacao SAR, ChinaMacedonia, FYRMadagascarMalawiMalaysiaMaldivesMaliMaltaMarshall IslandsMauritaniaMauritiusMexicoMicronesia, Fed. Sts.MoldovaMongoliaMontenegroMoroccoMozambiqueMyanmarNamibiaNepalNetherlandsNew CaledoniaNew ZealandNicaraguaNigerNigeriaNorwayOmanPakistanPalauPanamaPapua New GuineaParaguayPeruPhilippinesPolandPortugalPuerto RicoQatarRomaniaRussian FederationRwandaSamoaSao Tome and PrincipeSaudi ArabiaSenegalSerbiaSeychellesSierra LeoneSingaporeSlovak RepublicSloveniaSolomon IslandsSomaliaSouth AfricaSpainSri LankaSt. Kitts and NevisSt. LuciaSt. Vincent and the GrenadinesSudanSurinameSwazilandSwedenSwitzerlandSyrian Arab RepublicTajikistanTanzaniaThailandTimor-LesteTogoTongaTrinidad and TobagoTunisiaTurkeyTurkmenistanTuvaluUgandaUkraineUnited Arab EmiratesUnited KingdomUnited StatesUruguayUzbekistanVanuatuVenezuela, RBVietnamWest Bank and GazaYemen, Rep.ZambiaZimbabwe línea de tiempo (timeline):
En esta escala de tiempo se presenta un gráfico de 1994 y 2016 de Jamaica. Los datos de 1993 están ausentes. El número de observaciones reales por fecha: 23.
Fuente (nombre):
Indicadores del desarrollo mundial
Fuente (organización):
World Bank national accounts data, and OECD National Accounts data files.
Categorías:
Economy & Growth
Se ha actualizado:
23 abr 2017 año
Los indicadores de los cambios de valor en los últimos años
Mínimo:
19.463 bn
1 ene 1994 año
Máximo:
137.271 bn
1 ene 2016 año
A la fecha de observación
Valor
Cambio absoluto
El cambio con respecto al valor anterior
1 ene 1994 año
19.463 bn
+19.463 bn
0.0%
1 ene 1995 año
25.705 bn
+6.242 bn
32.07%
1 ene 1996 año
30.387 bn
+4.682 bn
18.21%
1 ene 1997 año
34.862 bn
+4.475 bn
14.73%
1 ene 1998 año
36.605 bn
+1.743 bn
5.0%
1 ene 1999 año
33.395 bn
-3.21 bn
-8.77%
1 ene 2000 año
34.695 bn
+1.3 bn
3.89%
1 ene 2001 año
36.336 bn
+1.641 bn
4.73%
1 ene 2002 año
37.974 bn
+1.638 bn
4.51%
1 ene 2003 año
39.629 bn
+1.654 bn
4.36%
1 ene 2004 año
45.107 bn
+5.478 bn
13.82%
1 ene 2005 año
51.167 bn
+6.06 bn
13.43%
1 ene 2006 año
54.282 bn
+3.115 bn
6.09%
1 ene 2007 año
59.727 bn
+5.445 bn
10.03%
1 ene 2008 año
68.1 bn
+8.373 bn
14.02%
1 ene 2009 año
80.236 bn
+12.136 bn
17.82%
1 ene 2010 año
87.467 bn
+7.231 bn
9.01%
1 ene 2011 año
89.231 bn
+1.764 bn
2.02%
1 ene 2012 año
97.592 bn
+8.361 bn
9.37%
1 ene 2013 año
105.787 bn
+8.195 bn
8.4%
1 ene 2014 año
115.652 bn
+9.865 bn
9.33%
1 ene 2015 año
124.144 bn
+8.492 bn
7.34%
1 ene 2016 año
137.271 bn
+13.127 bn
10.57%
Ranking de los países por los datos estadísticos actuales


Comentarios: