29
/es/
es
AIzaSyAYiBZKx7MnpbEhh9jyipgxe19OcubqV5w
April 1, 2024
159258
Ireland
IRL
true
2
1
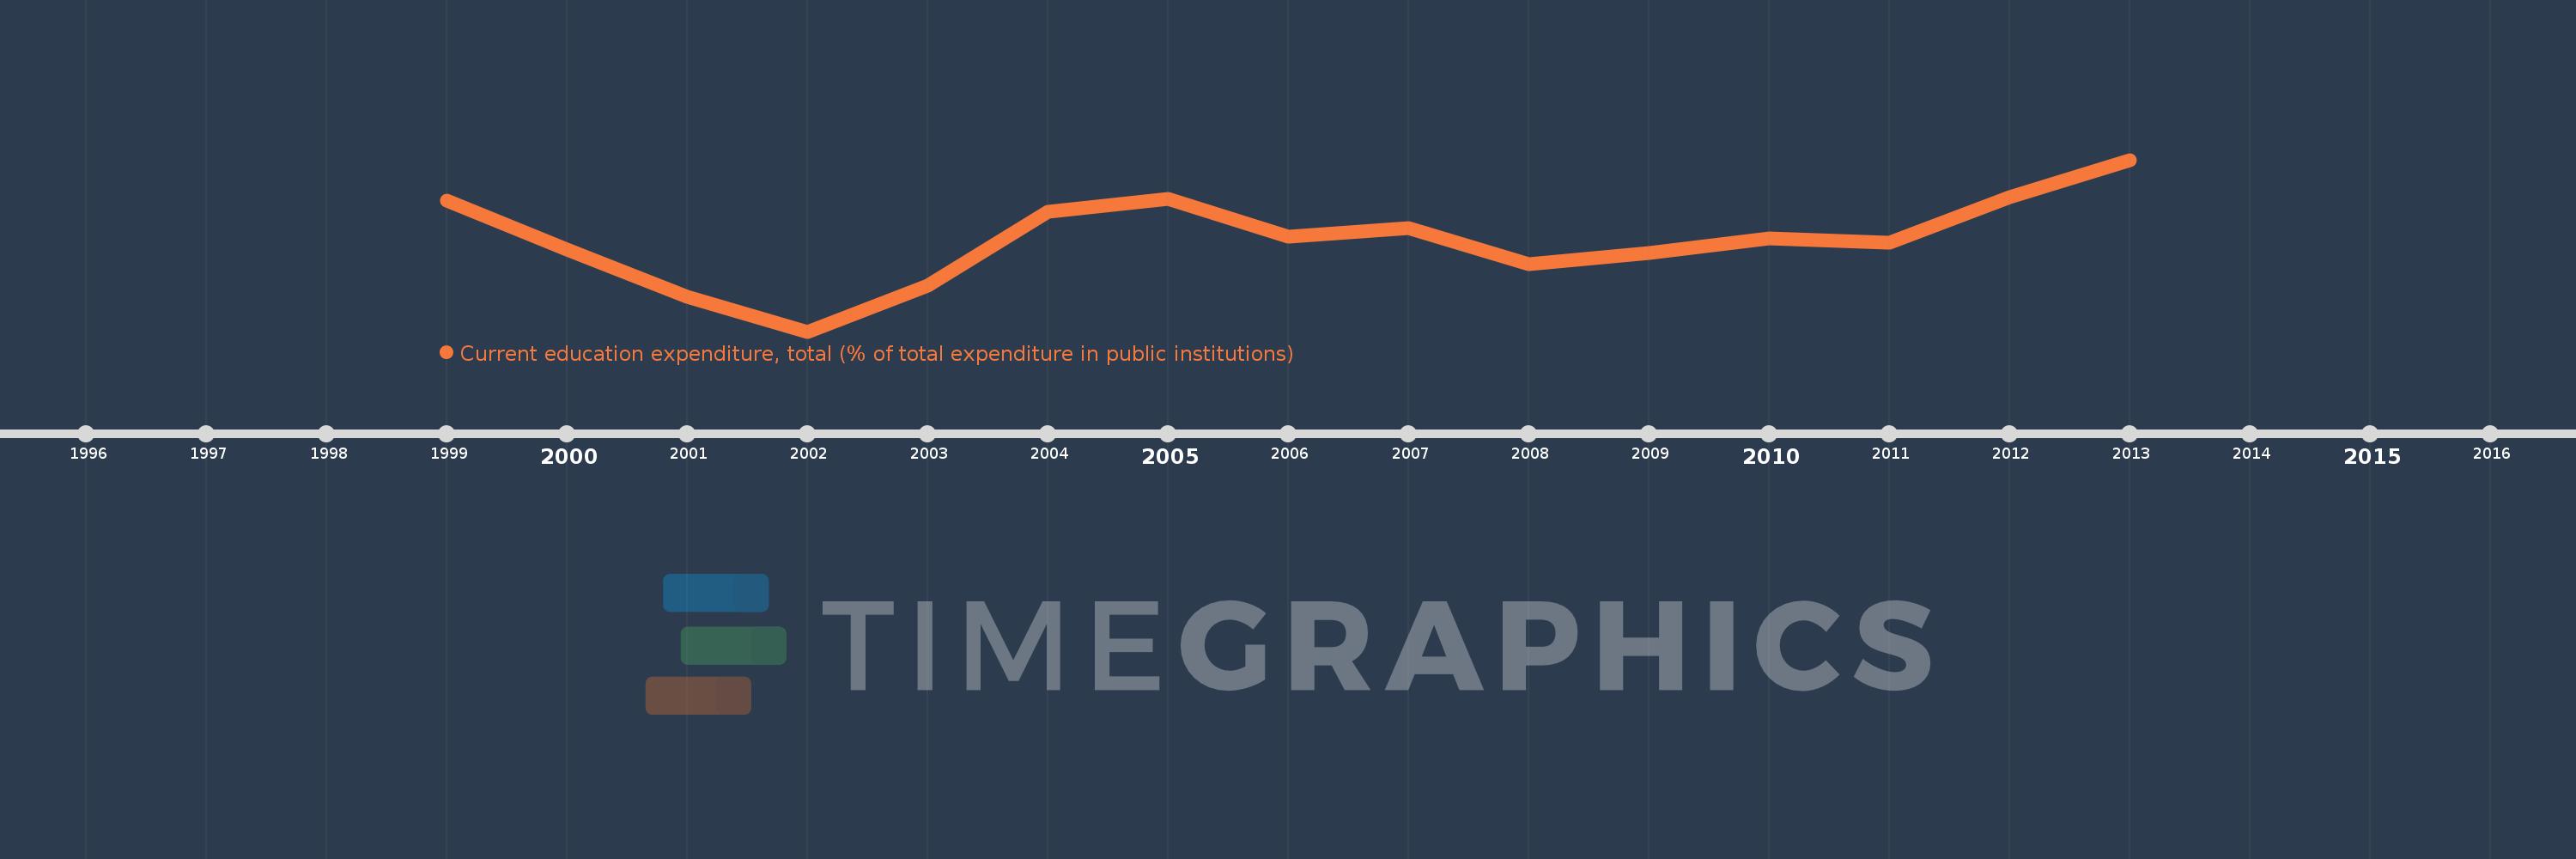
Current education expenditure, total (% of total expenditure in public institutions)
2013,2012,2011,2010,2009,2008,2007,2006,2005,2004,2003,2002,2001,2000,1999
Estas estadísticas en otros países:
línea de tiempo (timeline):
En esta escala de tiempo se presenta un gráfico de 1999 y 2013 de Ireland. Los datos de 1998 están ausentes. El número de observaciones reales por fecha: 15.
Fuente (nombre):
Indicadores del desarrollo mundial
Fuente (organización):
United Nations Educational, Scientific, and Cultural Organization (UNESCO) Institute for Statistics.
Categorías:
Education
Se ha actualizado:
23 abr 2017 año
Los indicadores de los cambios de valor en los últimos años
Mínimo:
87.365
1 ene 2002 año
Máximo:
94.948
1 ene 2013 año
A la fecha de observación
Valor
Cambio absoluto
El cambio con respecto al valor anterior
1 ene 1999 año
93.139
+93.139
0.0%
1 ene 2000 año
90.984
-2.155
-2.31%
1 ene 2001 año
88.901
-2.082
-2.29%
1 ene 2002 año
87.365
-1.537
-1.73%
1 ene 2003 año
89.392
+2.027
2.32%
1 ene 2004 año
92.667
+3.275
3.66%
1 ene 2005 año
93.236
+0.57
0.61%
1 ene 2006 año
91.561
-1.675
-1.8%
1 ene 2007 año
91.952
+0.391
0.43%
1 ene 2008 año
90.351
-1.601
-1.74%
1 ene 2009 año
90.836
+0.485
0.54%
1 ene 2010 año
91.466
+0.63
0.69%
1 ene 2011 año
91.294
-0.172
-0.19%
1 ene 2012 año
93.308
+2.014
2.21%
1 ene 2013 año
94.948
+1.64
1.76%
Ranking de los países por los datos estadísticos actuales


Comentarios: