29
/es/
es
AIzaSyAYiBZKx7MnpbEhh9jyipgxe19OcubqV5w
April 1, 2024
158471
Iraq
IRQ
true
2
1
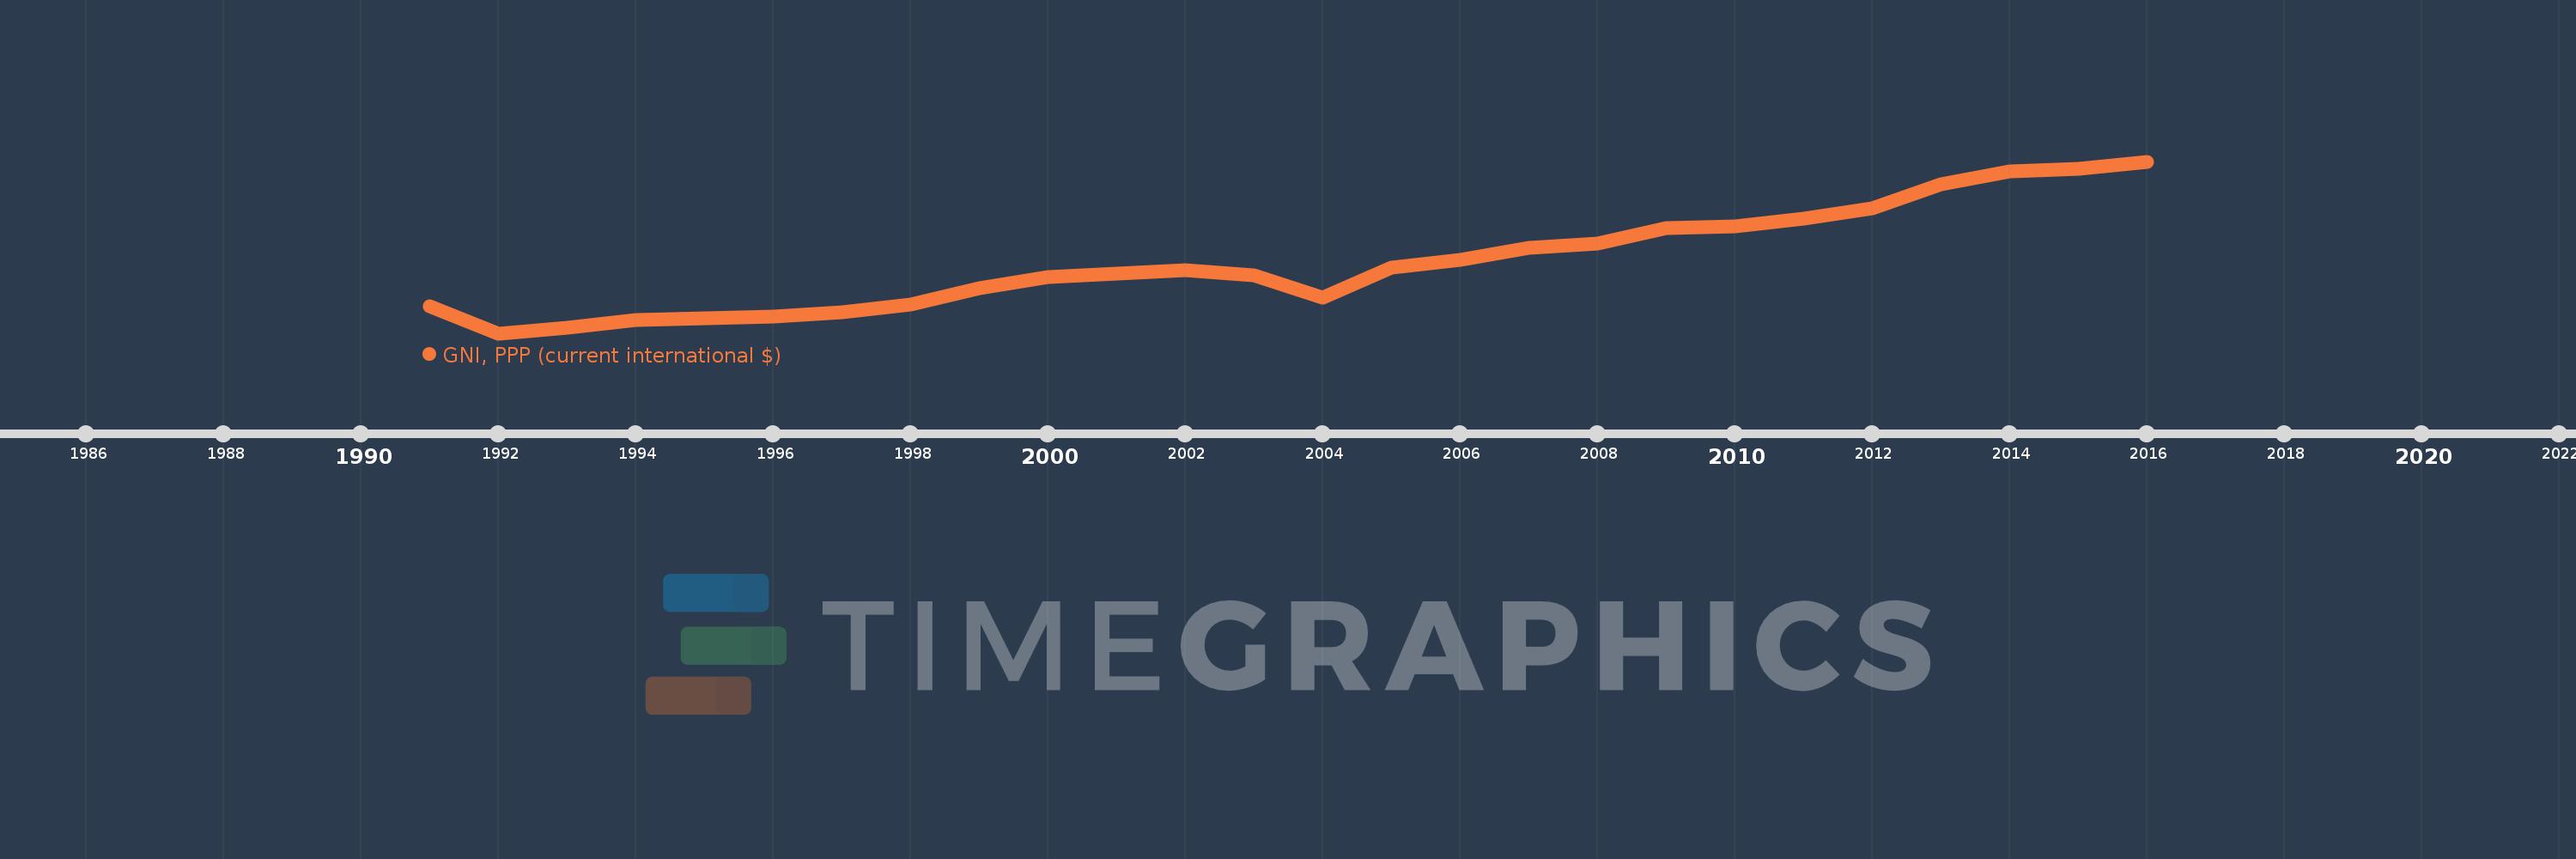
GNI, PPP (current international $)
2016,2015,2014,2013,2012,2011,2010,2009,2008,2007,2006,2005,2004,2003,2002,2001,2000,1999,1998,1997,1996,1995,1994,1993,1992,1991
Estas estadísticas en otros países:
AfghanistanAlbaniaAlgeriaAngolaAntigua and BarbudaArab WorldArgentinaArmeniaAustraliaAustriaAzerbaijanBahamas, TheBahrainBangladeshBarbadosBelarusBelgiumBelizeBeninBermudaBhutanBoliviaBosnia and HerzegovinaBotswanaBrazilBrunei DarussalamBulgariaBurkina FasoBurundiCabo VerdeCambodiaCameroonCanadaCaribbean small statesCentral African RepublicCentral Europe and the BalticsChadChileChinaColombiaComorosCongo, Dem. Rep.Congo, Rep.Costa RicaCote d'IvoireCroatiaCubaCyprusCzech RepublicDenmarkDjiboutiDominicaDominican RepublicEarly-demographic dividendEast Asia & PacificEast Asia & Pacific (excluding high income)East Asia & Pacific (IDA & IBRD countries)EcuadorEgypt, Arab Rep.El SalvadorEquatorial GuineaEritreaEstoniaEthiopiaEuro areaEurope & Central AsiaEurope & Central Asia (excluding high income)Europe & Central Asia (IDA & IBRD countries)European UnionFijiFinlandFragile and conflict affected situationsFranceGabonGambia, TheGeorgiaGermanyGhanaGreeceGrenadaGuatemalaGuineaGuinea-BissauGuyanaHaitiHeavily indebted poor countries (HIPC)High incomeHondurasHong Kong SAR, ChinaHungaryIBRD onlyIcelandIDA & IBRD totalIDA blendIDA onlyIDA totalIndiaIndonesiaIran, Islamic Rep.IraqIrelandIsraelItalyJamaicaJapanJordanKazakhstanKenyaKiribatiKorea, Rep.KosovoKuwaitKyrgyz RepublicLao PDRLate-demographic dividendLatin America & Caribbean Latin America & Caribbean (excluding high income)Latin America & the Caribbean (IDA & IBRD countries)LatviaLeast developed countries: UN classificationLebanonLesothoLiberiaLibyaLithuaniaLow & middle incomeLow incomeLower middle incomeLuxembourgMacao SAR, ChinaMacedonia, FYRMadagascarMalawiMalaysiaMaldivesMaliMaltaMarshall IslandsMauritaniaMauritiusMexicoMicronesia, Fed. Sts.Middle East & North AfricaMiddle East & North Africa (excluding high income)Middle East & North Africa (IDA & IBRD countries)Middle incomeMoldovaMongoliaMontenegroMoroccoMozambiqueMyanmarNamibiaNauruNepalNetherlandsNew ZealandNicaraguaNigerNigeriaNorth AmericaNorwayOECD membersOmanOther small statesPacific island small statesPakistanPalauPanamaPapua New GuineaParaguayPeruPhilippinesPolandPortugalPost-demographic dividendPre-demographic dividendPuerto RicoQatarRomaniaRussian FederationRwandaSamoaSao Tome and PrincipeSaudi ArabiaSenegalSerbiaSeychellesSierra LeoneSingaporeSlovak RepublicSloveniaSmall statesSolomon IslandsSouth AfricaSouth AsiaSouth Asia (IDA & IBRD)South SudanSpainSri LankaSt. Kitts and NevisSt. LuciaSt. Vincent and the GrenadinesSub-Saharan Africa Sub-Saharan Africa (excluding high income)Sub-Saharan Africa (IDA & IBRD countries)SudanSurinameSwazilandSwedenSwitzerlandTajikistanTanzaniaThailandTimor-LesteTogoTongaTrinidad and TobagoTunisiaTurkeyTurkmenistanTuvaluUgandaUkraineUnited Arab EmiratesUnited KingdomUnited StatesUpper middle incomeUruguayUzbekistanVanuatuVenezuela, RBVietnamWest Bank and GazaWorldYemen, Rep.ZambiaZimbabwe línea de tiempo (timeline):
En esta escala de tiempo se presenta un gráfico de 1991 y 2016 de Iraq. Los datos de 1990 están ausentes. El número de observaciones reales por fecha: 26.
Fuente (nombre):
Indicadores del desarrollo mundial
Fuente (organización):
World Bank, International Comparison Program database.
Categorías:
Economy & Growth
Se ha actualizado:
23 abr 2017 año
Los indicadores de los cambios de valor en los últimos años
Mínimo:
47.587 bn
1 ene 1992 año
Máximo:
558.863 bn
1 ene 2016 año
A la fecha de observación
Valor
Cambio absoluto
El cambio con respecto al valor anterior
1 ene 1991 año
128.142 bn
+128.142 bn
0.0%
1 ene 1992 año
47.587 bn
-80.555 bn
-62.86%
1 ene 1993 año
64.811 bn
+17.224 bn
36.19%
1 ene 1994 año
87.419 bn
+22.608 bn
34.88%
1 ene 1995 año
92.725 bn
+5.306 bn
6.07%
1 ene 1996 año
96.639 bn
+3.914 bn
4.22%
1 ene 1997 año
109.237 bn
+12.598 bn
13.04%
1 ene 1998 año
132.992 bn
+23.754 bn
21.75%
1 ene 1999 año
181.246 bn
+48.254 bn
36.28%
1 ene 2000 año
215.459 bn
+34.213 bn
18.88%
1 ene 2001 año
226.012 bn
+10.553 bn
4.9%
1 ene 2002 año
236.295 bn
+10.283 bn
4.55%
1 ene 2003 año
221.114 bn
-15.181 bn
-6.42%
1 ene 2004 año
153.675 bn
-67.439 bn
-30.5%
1 ene 2005 año
243.495 bn
+89.82 bn
58.45%
1 ene 2006 año
265.895 bn
+22.4 bn
9.2%
1 ene 2007 año
301.589 bn
+35.693 bn
13.42%
1 ene 2008 año
314.839 bn
+13.25 bn
4.39%
1 ene 2009 año
359.942 bn
+45.102 bn
14.33%
1 ene 2010 año
365.767 bn
+5.825 bn
1.62%
1 ene 2011 año
387.717 bn
+21.951 bn
6.0%
1 ene 2012 año
420.295 bn
+32.577 bn
8.4%
1 ene 2013 año
490.592 bn
+70.297 bn
16.73%
1 ene 2014 año
528.484 bn
+37.892 bn
7.72%
1 ene 2015 año
535.909 bn
+7.425 bn
1.4%
1 ene 2016 año
558.863 bn
+22.955 bn
4.28%
Ranking de los países por los datos estadísticos actuales


Comentarios: