29
/es/
es
AIzaSyAYiBZKx7MnpbEhh9jyipgxe19OcubqV5w
April 1, 2024
157447
Iran, Islamic Rep.
IRN
true
2
1
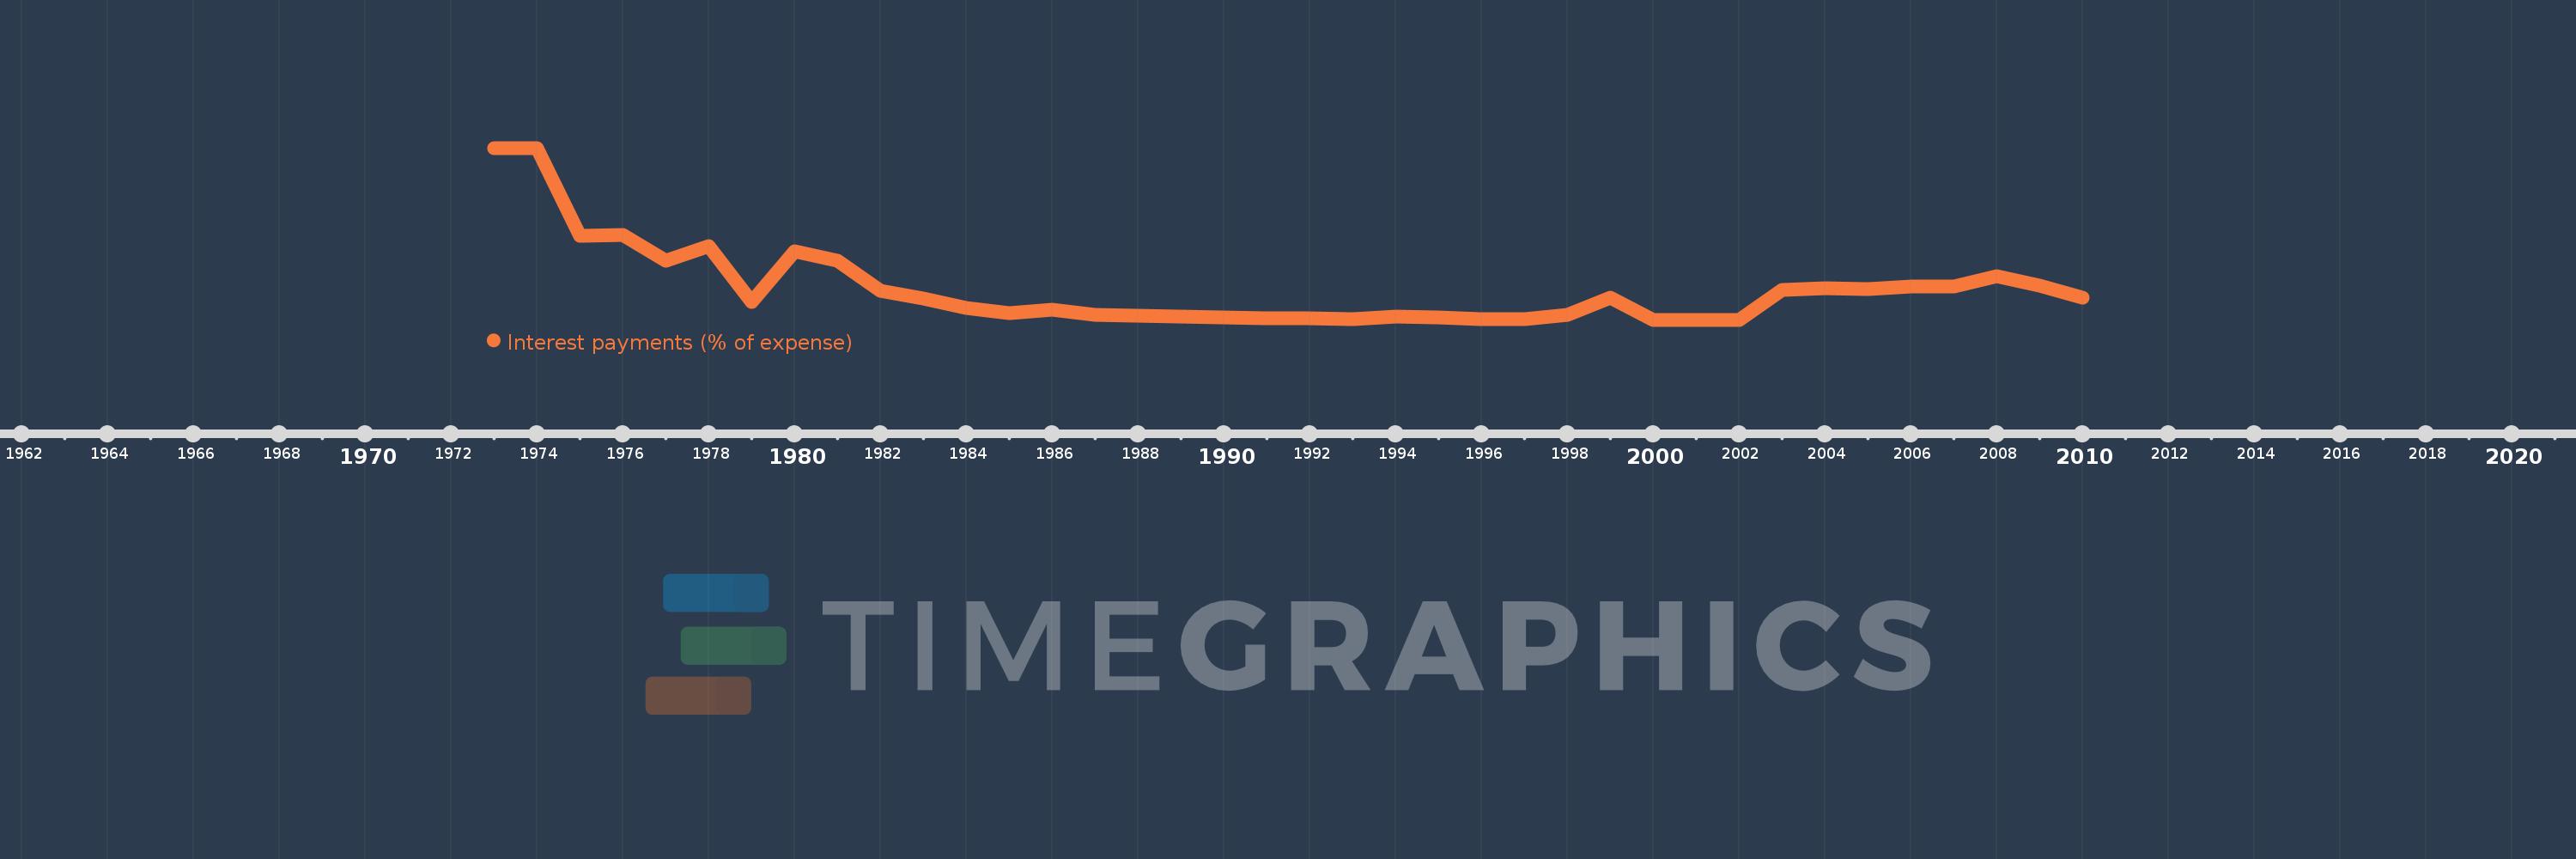
Interest payments (% of expense)
2010,2009,2008,2007,2006,2005,2004,2003,2002,2001,2000,1999,1998,1997,1996,1995,1994,1993,1992,1991,1990,1989,1988,1987,1986,1985,1984,1983,1982,1981,1980,1979,1978,1977,1976,1975,1974,1973
Estas estadísticas en otros países:
AfghanistanAlbaniaAlgeriaAngolaAntigua and BarbudaArab WorldArmeniaAustraliaAustriaAzerbaijanBahamas, TheBahrainBangladeshBarbadosBelarusBelgiumBelizeBeninBhutanBoliviaBosnia and HerzegovinaBotswanaBrazilBulgariaBurkina FasoBurundiCabo VerdeCambodiaCanadaCaribbean small statesCentral African RepublicCentral Europe and the BalticsChileColombiaCongo, Dem. Rep.Congo, Rep.Costa RicaCote d'IvoireCroatiaCyprusCzech RepublicDenmarkDominicaDominican RepublicEarly-demographic dividendEast Asia & PacificEast Asia & Pacific (excluding high income)East Asia & Pacific (IDA & IBRD countries)Egypt, Arab Rep.El SalvadorEquatorial GuineaEstoniaEthiopiaEuro areaEurope & Central AsiaEurope & Central Asia (excluding high income)Europe & Central Asia (IDA & IBRD countries)European UnionFijiFinlandFranceGambia, TheGeorgiaGermanyGhanaGreeceGrenadaGuatemalaHeavily indebted poor countries (HIPC)High incomeHondurasHong Kong SAR, ChinaHungaryIBRD onlyIcelandIDA & IBRD totalIDA blendIDA onlyIDA totalIndiaIndonesiaIran, Islamic Rep.IraqIrelandIsraelItalyJamaicaJapanJordanKazakhstanKenyaKiribatiKorea, Rep.KuwaitKyrgyz RepublicLao PDRLate-demographic dividendLatin America & Caribbean Latin America & Caribbean (excluding high income)Latin America & the Caribbean (IDA & IBRD countries)LatviaLeast developed countries: UN classificationLebanonLesothoLiberiaLithuaniaLow & middle incomeLow incomeLower middle incomeLuxembourgMacao SAR, ChinaMacedonia, FYRMadagascarMalawiMalaysiaMaldivesMaliMaltaMauritiusMexicoMicronesia, Fed. Sts.Middle East & North AfricaMiddle East & North Africa (excluding high income)Middle East & North Africa (IDA & IBRD countries)Middle incomeMoldovaMongoliaMoroccoMozambiqueNamibiaNepalNetherlandsNew ZealandNicaraguaNigeriaNorth AmericaNorwayOECD membersOmanOther small statesPakistanPanamaPapua New GuineaParaguayPeruPhilippinesPolandPortugalPost-demographic dividendPre-demographic dividendQatarRomaniaRussian FederationRwandaSamoaSan MarinoSao Tome and PrincipeSenegalSerbiaSeychellesSierra LeoneSingaporeSlovak RepublicSloveniaSmall statesSolomon IslandsSouth AfricaSouth AsiaSouth Asia (IDA & IBRD)SpainSri LankaSt. Kitts and NevisSt. LuciaSub-Saharan Africa Sub-Saharan Africa (excluding high income)Sub-Saharan Africa (IDA & IBRD countries)SurinameSwazilandSwedenSwitzerlandSyrian Arab RepublicTajikistanTanzaniaThailandTimor-LesteTogoTrinidad and TobagoTunisiaTurkeyUgandaUkraineUnited KingdomUnited StatesUpper middle incomeUruguayVanuatuVenezuela, RBVietnamWest Bank and GazaWorldYemen, Rep.ZambiaZimbabwe línea de tiempo (timeline):
En esta escala de tiempo se presenta un gráfico de 1973 y 2010 de Iran, Islamic Rep.. Los datos de 1972 están ausentes. El número de observaciones reales por fecha: 38.
Fuente (nombre):
Indicadores del desarrollo mundial
Fuente (organización):
International Monetary Fund, Government Finance Statistics Yearbook and data files.
Categorías:
Public Sector
Se ha actualizado:
23 abr 2017 año
Los indicadores de los cambios de valor en los últimos años
Máximo:
5.601
1 ene 1974 año
A la fecha de observación
Valor
Cambio absoluto
El cambio con respecto al valor anterior
1 ene 1973 año
5.597
+5.597
0.0%
1 ene 1974 año
5.601
+0.004
0.07%
1 ene 1975 año
2.738
-2.862
-51.11%
1 ene 1976 año
2.761
+0.023
0.83%
1 ene 1977 año
1.912
-0.849
-30.76%
1 ene 1978 año
2.408
+0.496
25.94%
1 ene 1979 año
0.578
-1.83
-76.0%
1 ene 1980 año
2.243
+1.665
288.11%
1 ene 1981 año
1.911
-0.332
-14.81%
1 ene 1982 año
0.956
-0.954
-49.96%
1 ene 1983 año
0.683
-0.273
-28.6%
1 ene 1984 año
0.379
-0.304
-44.5%
1 ene 1985 año
0.228
-0.151
-39.88%
1 ene 1986 año
0.331
+0.103
45.36%
1 ene 1987 año
0.165
-0.166
-50.24%
1 ene 1988 año
0.126
-0.039
-23.8%
1 ene 1989 año
0.114
-0.011
-8.83%
1 ene 1990 año
0.076
-0.039
-33.68%
1 ene 1991 año
0.054
-0.022
-29.07%
1 ene 1992 año
0.042
-0.012
-21.55%
1 ene 1993 año
0.03
-0.012
-28.86%
1 ene 1994 año
0.095
+0.065
217.1%
1 ene 1995 año
0.088
-0.008
-8.17%
1 ene 1996 año
0.024
-0.064
-72.76%
1 ene 1997 año
0.028
+0.005
19.24%
1 ene 1998 año
0.173
+0.144
507.1%
1 ene 1999 año
0.724
+0.551
319.49%
1 ene 2000 año
0.0
-0.724
-99.99%
1 ene 2001 año
0.0
+0.0
4.0%
1 ene 2002 año
0.0
+0.0
15.9%
1 ene 2003 año
0.974
+0.974
1.1 millones%
1 ene 2004 año
1.027
+0.053
5.44%
1 ene 2005 año
1.01
-0.018
-1.75%
1 ene 2006 año
1.082
+0.072
7.13%
1 ene 2007 año
1.078
-0.004
-0.36%
1 ene 2008 año
1.416
+0.338
31.4%
1 ene 2009 año
1.124
-0.292
-20.63%
1 ene 2010 año
0.731
-0.393
-34.95%
Ranking de los países por los datos estadísticos actuales


Comentarios: