29
/es/
es
AIzaSyAYiBZKx7MnpbEhh9jyipgxe19OcubqV5w
April 1, 2024
157332
Iran, Islamic Rep.
IRN
true
2
1
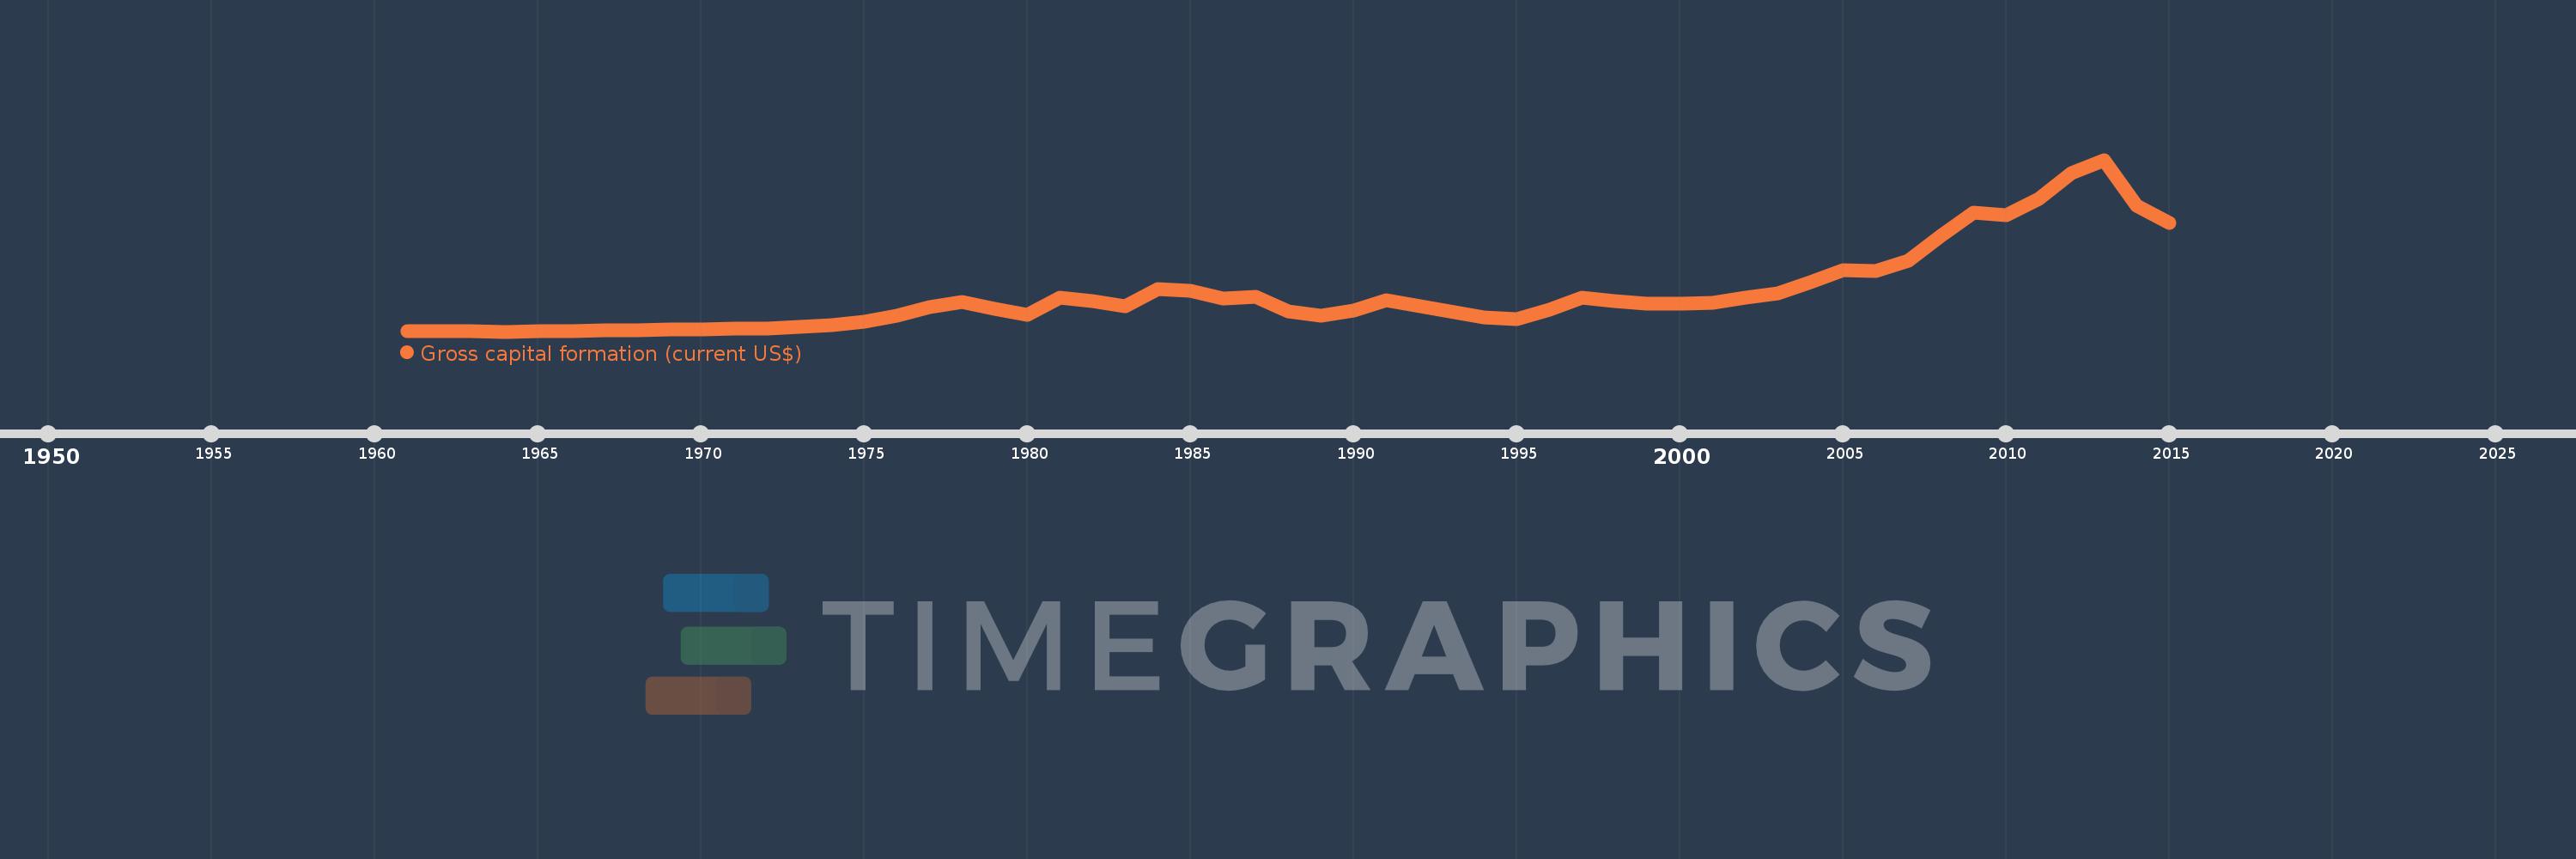
Gross capital formation (current US$)
2015,2014,2013,2012,2011,2010,2009,2008,2007,2006,2005,2004,2003,2002,2001,2000,1999,1998,1997,1996,1995,1994,1991,1990,1989,1988,1987,1986,1985,1984,1983,1982,1981,1980,1979,1978,1977,1976,1975,1974,1973,1972,1971,1970,1969,1968,1967,1966,1965,1964,1963,1962,1961
Estas estadísticas en otros países:
AfghanistanAlbaniaAlgeriaAngolaAntigua and BarbudaArab WorldArgentinaArmeniaArubaAustraliaAustriaAzerbaijanBahamas, TheBahrainBangladeshBarbadosBelarusBelgiumBelizeBeninBermudaBhutanBoliviaBosnia and HerzegovinaBotswanaBrazilBrunei DarussalamBulgariaBurkina FasoBurundiCabo VerdeCambodiaCameroonCanadaCaribbean small statesCentral African RepublicCentral Europe and the BalticsChadChileChinaColombiaComorosCongo, Dem. Rep.Congo, Rep.Costa RicaCote d'IvoireCroatiaCubaCyprusCzech RepublicDenmarkDjiboutiDominicaDominican RepublicEarly-demographic dividendEast Asia & PacificEast Asia & Pacific (excluding high income)East Asia & Pacific (IDA & IBRD countries)EcuadorEgypt, Arab Rep.El SalvadorEquatorial GuineaEritreaEstoniaEthiopiaEuro areaEurope & Central AsiaEurope & Central Asia (excluding high income)Europe & Central Asia (IDA & IBRD countries)European UnionFaroe IslandsFijiFinlandFragile and conflict affected situationsFranceGabonGambia, TheGeorgiaGermanyGhanaGreeceGrenadaGuatemalaGuineaGuinea-BissauGuyanaHaitiHeavily indebted poor countries (HIPC)High incomeHondurasHong Kong SAR, ChinaHungaryIBRD onlyIcelandIDA & IBRD totalIDA blendIDA onlyIDA totalIndiaIndonesiaIran, Islamic Rep.IraqIrelandIsraelItalyJamaicaJapanJordanKazakhstanKenyaKiribatiKorea, Rep.KosovoKuwaitKyrgyz RepublicLao PDRLate-demographic dividendLatin America & Caribbean Latin America & Caribbean (excluding high income)Latin America & the Caribbean (IDA & IBRD countries)LatviaLeast developed countries: UN classificationLebanonLesothoLiberiaLibyaLithuaniaLow & middle incomeLow incomeLower middle incomeLuxembourgMacao SAR, ChinaMacedonia, FYRMadagascarMalawiMalaysiaMaldivesMaliMaltaMauritaniaMauritiusMexicoMicronesia, Fed. Sts.Middle East & North AfricaMiddle East & North Africa (excluding high income)Middle East & North Africa (IDA & IBRD countries)Middle incomeMoldovaMongoliaMontenegroMoroccoMozambiqueNamibiaNepalNetherlandsNew CaledoniaNew ZealandNicaraguaNigerNigeriaNorth AmericaNorwayOECD membersOmanOther small statesPakistanPanamaPapua New GuineaParaguayPeruPhilippinesPolandPortugalPost-demographic dividendPre-demographic dividendPuerto RicoQatarRomaniaRussian FederationRwandaSaudi ArabiaSenegalSerbiaSeychellesSierra LeoneSingaporeSlovak RepublicSloveniaSmall statesSolomon IslandsSouth AfricaSouth AsiaSouth Asia (IDA & IBRD)South SudanSpainSri LankaSt. Kitts and NevisSt. LuciaSt. Vincent and the GrenadinesSub-Saharan Africa Sub-Saharan Africa (excluding high income)Sub-Saharan Africa (IDA & IBRD countries)SudanSurinameSwazilandSwedenSwitzerlandSyrian Arab RepublicTajikistanTanzaniaThailandTimor-LesteTogoTongaTrinidad and TobagoTunisiaTurkeyTurkmenistanUgandaUkraineUnited Arab EmiratesUnited KingdomUnited StatesUpper middle incomeUruguayUzbekistanVanuatuVenezuela, RBVietnamWest Bank and GazaWorldYemen, Rep.ZambiaZimbabwe línea de tiempo (timeline):
En esta escala de tiempo se presenta un gráfico de 1961 y 2015 de Iran, Islamic Rep.. Los datos de 1960 están ausentes. El número de observaciones reales por fecha: 53.
Fuente (nombre):
Indicadores del desarrollo mundial
Fuente (organización):
World Bank national accounts data, and OECD National Accounts data files.
Categorías:
Economy & Growth
Se ha actualizado:
23 abr 2017 año
Los indicadores de los cambios de valor en los últimos años
Mínimo:
948.369 millones
1 ene 1964 año
Máximo:
224.346 bn
1 ene 2013 año
A la fecha de observación
Valor
Cambio absoluto
El cambio con respecto al valor anterior
1 ene 1961 año
1.056 bn
+1.056 bn
0.0%
1 ene 1962 año
1.115 bn
+58.705 millones
5.56%
1 ene 1963 año
1.147 bn
+31.807 millones
2.85%
1 ene 1964 año
948.369 millones
-198.223 millones
-17.29%
1 ene 1965 año
1.432 bn
+483.303 millones
50.96%
1 ene 1966 año
1.974 bn
+542.577 millones
37.9%
1 ene 1967 año
2.323 bn
+349.172 millones
17.69%
1 ene 1968 año
2.58 bn
+256.488 millones
11.04%
1 ene 1969 año
3.57 bn
+990.227 millones
38.38%
1 ene 1970 año
3.912 bn
+342.16 millones
9.58%
1 ene 1971 año
4.46 bn
+548.055 millones
14.01%
1 ene 1972 año
4.779 bn
+319.084 millones
7.15%
1 ene 1973 año
6.88 bn
+2.1 bn
43.94%
1 ene 1974 año
9.498 bn
+2.619 bn
38.07%
1 ene 1975 año
14.338 bn
+4.84 bn
50.96%
1 ene 1976 año
21.433 bn
+7.094 bn
49.48%
1 ene 1977 año
32.728 bn
+11.295 bn
52.7%
1 ene 1978 año
39.034 bn
+6.306 bn
19.27%
1 ene 1979 año
30.515 bn
-8.518 bn
-21.82%
1 ene 1980 año
22.605 bn
-7.91 bn
-25.92%
1 ene 1981 año
45.166 bn
+22.561 bn
99.8%
1 ene 1982 año
40.276 bn
-4.89 bn
-10.83%
1 ene 1983 año
33.72 bn
-6.555 bn
-16.28%
1 ene 1984 año
56.711 bn
+22.99 bn
68.18%
1 ene 1985 año
53.625 bn
-3.086 bn
-5.44%
1 ene 1986 año
43.74 bn
-9.885 bn
-18.43%
1 ene 1987 año
46.446 bn
+2.707 bn
6.19%
1 ene 1988 año
26.927 bn
-19.52 bn
-42.03%
1 ene 1989 año
21.085 bn
-5.842 bn
-21.7%
1 ene 1990 año
27.772 bn
+6.687 bn
31.72%
1 ene 1991 año
41.216 bn
+13.444 bn
48.41%
1 ene 1994 año
19.375 bn
-21.841 bn
-52.99%
1 ene 1995 año
16.735 bn
-2.64 bn
-13.63%
1 ene 1996 año
29.099 bn
+12.364 bn
73.88%
1 ene 1997 año
45.496 bn
+16.396 bn
56.35%
1 ene 1998 año
40.49 bn
-5.006 bn
-11.0%
1 ene 1999 año
37.339 bn
-3.152 bn
-7.78%
1 ene 2000 año
37.048 bn
-290.407 millones
-0.78%
1 ene 2001 año
38.467 bn
+1.419 bn
3.83%
1 ene 2002 año
44.727 bn
+6.26 bn
16.27%
1 ene 2003 año
50.234 bn
+5.507 bn
12.31%
1 ene 2004 año
64.65 bn
+14.416 bn
28.7%
1 ene 2005 año
80.345 bn
+15.694 bn
24.28%
1 ene 2006 año
79.745 bn
-599.896 millones
-0.75%
1 ene 2007 año
93.399 bn
+13.654 bn
17.12%
1 ene 2008 año
125.495 bn
+32.096 bn
34.36%
1 ene 2009 año
155.522 bn
+30.027 bn
23.93%
1 ene 2010 año
151.81 bn
-3.712 bn
-2.39%
1 ene 2011 año
173.695 bn
+21.885 bn
14.42%
1 ene 2012 año
207.448 bn
+33.752 bn
19.43%
1 ene 2013 año
224.346 bn
+16.898 bn
8.15%
1 ene 2014 año
164.164 bn
-60.182 bn
-26.83%
1 ene 2015 año
142.019 bn
-22.145 bn
-13.49%
Ranking de los países por los datos estadísticos actuales


Comentarios: