29
/es/
es
AIzaSyAYiBZKx7MnpbEhh9jyipgxe19OcubqV5w
April 1, 2024
153286
Iceland
ISL
true
2
1
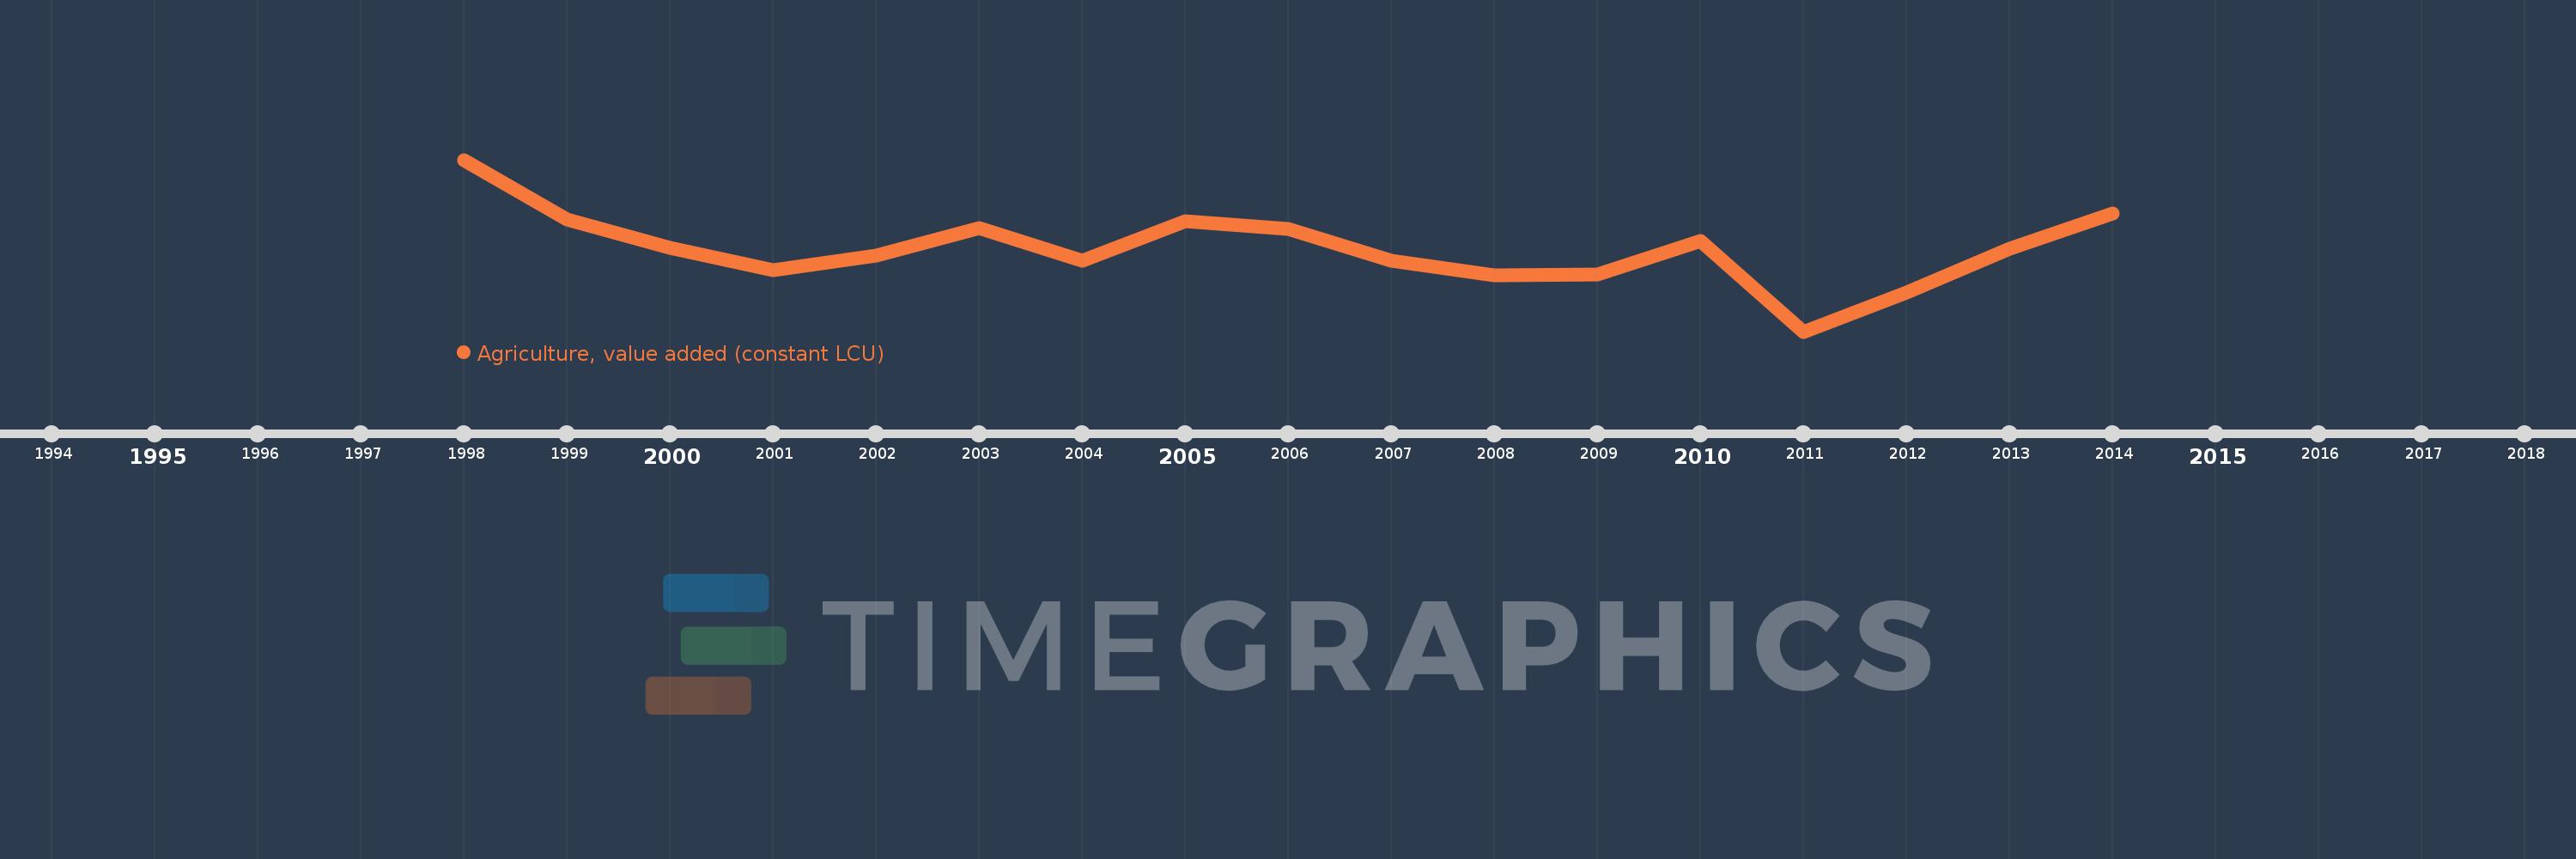
Agriculture, value added (constant LCU)
2014,2013,2012,2011,2010,2009,2008,2007,2006,2005,2004,2003,2002,2001,2000,1999,1998
Estas estadísticas en otros países:
AfghanistanAlbaniaAlgeriaAntigua and BarbudaArgentinaArmeniaAustraliaAustriaAzerbaijanBahamas, TheBahrainBangladeshBelarusBelgiumBelizeBeninBermudaBhutanBoliviaBosnia and HerzegovinaBotswanaBrazilBrunei DarussalamBulgariaBurkina FasoBurundiCabo VerdeCambodiaCameroonCanadaCayman IslandsCentral African RepublicChadChileChinaColombiaComorosCongo, Dem. Rep.Congo, Rep.Costa RicaCote d'IvoireCroatiaCubaCyprusCzech RepublicDenmarkDjiboutiDominicaDominican RepublicEcuadorEgypt, Arab Rep.El SalvadorEquatorial GuineaEritreaEstoniaEthiopiaFijiFinlandFranceGabonGambia, TheGeorgiaGermanyGhanaGreeceGrenadaGuatemalaGuineaGuinea-BissauGuyanaHaitiHondurasHong Kong SAR, ChinaHungaryIcelandIndiaIndonesiaIran, Islamic Rep.IraqIrelandItalyJamaicaJapanJordanKazakhstanKenyaKiribatiKorea, Rep.KosovoKuwaitKyrgyz RepublicLao PDRLatviaLebanonLesothoLiberiaLithuaniaLuxembourgMacedonia, FYRMadagascarMalawiMalaysiaMaldivesMaliMarshall IslandsMauritaniaMauritiusMexicoMicronesia, Fed. Sts.MoldovaMongoliaMontenegroMoroccoMozambiqueMyanmarNamibiaNepalNetherlandsNew ZealandNicaraguaNigerNigeriaNorwayOmanPakistanPalauPanamaPapua New GuineaParaguayPeruPhilippinesPolandPortugalPuerto RicoQatarRomaniaRussian FederationRwandaSamoaSao Tome and PrincipeSaudi ArabiaSenegalSerbiaSeychellesSierra LeoneSingaporeSlovak RepublicSloveniaSolomon IslandsSomaliaSouth AfricaSpainSri LankaSt. Kitts and NevisSt. LuciaSt. Vincent and the GrenadinesSudanSurinameSwazilandSwedenSwitzerlandSyrian Arab RepublicTajikistanTanzaniaThailandTimor-LesteTogoTongaTrinidad and TobagoTunisiaTurkeyTurkmenistanTuvaluUgandaUkraineUnited Arab EmiratesUnited KingdomUnited StatesUruguayUzbekistanVanuatuVenezuela, RBVietnamWest Bank and GazaZambiaZimbabwe línea de tiempo (timeline):
En esta escala de tiempo se presenta un gráfico de 1998 y 2014 de Iceland. Los datos de 1997 están ausentes. El número de observaciones reales por fecha: 17.
Fuente (nombre):
Indicadores del desarrollo mundial
Fuente (organización):
World Bank national accounts data, and OECD National Accounts data files.
Categorías:
Economy & Growth
Se ha actualizado:
23 abr 2017 año
Los indicadores de los cambios de valor en los últimos años
Mínimo:
107.233 bn
1 ene 2011 año
Máximo:
125.915 bn
1 ene 1998 año
A la fecha de observación
Valor
Cambio absoluto
El cambio con respecto al valor anterior
1 ene 1998 año
125.915 bn
+125.915 bn
0.0%
1 ene 1999 año
119.427 bn
-6.488 bn
-5.15%
1 ene 2000 año
116.297 bn
-3.13 bn
-2.62%
1 ene 2001 año
113.921 bn
-2.376 bn
-2.04%
1 ene 2002 año
115.51 bn
+1.589 bn
1.4%
1 ene 2003 año
118.49 bn
+2.98 bn
2.58%
1 ene 2004 año
114.934 bn
-3.556 bn
-3.0%
1 ene 2005 año
119.206 bn
+4.272 bn
3.72%
1 ene 2006 año
118.375 bn
-830.845 millones
-0.7%
1 ene 2007 año
114.952 bn
-3.424 bn
-2.89%
1 ene 2008 año
113.317 bn
-1.634 bn
-1.42%
1 ene 2009 año
113.452 bn
+134.509 millones
0.12%
1 ene 2010 año
117.058 bn
+3.606 bn
3.18%
1 ene 2011 año
107.233 bn
-9.825 bn
-8.39%
1 ene 2012 año
111.448 bn
+4.215 bn
3.93%
1 ene 2013 año
116.211 bn
+4.763 bn
4.27%
1 ene 2014 año
120.051 bn
+3.841 bn
3.3%
Ranking de los países por los datos estadísticos actuales


Comentarios: