29
/es/
es
AIzaSyAYiBZKx7MnpbEhh9jyipgxe19OcubqV5w
April 1, 2024
150362
Honduras
HND
true
2
1
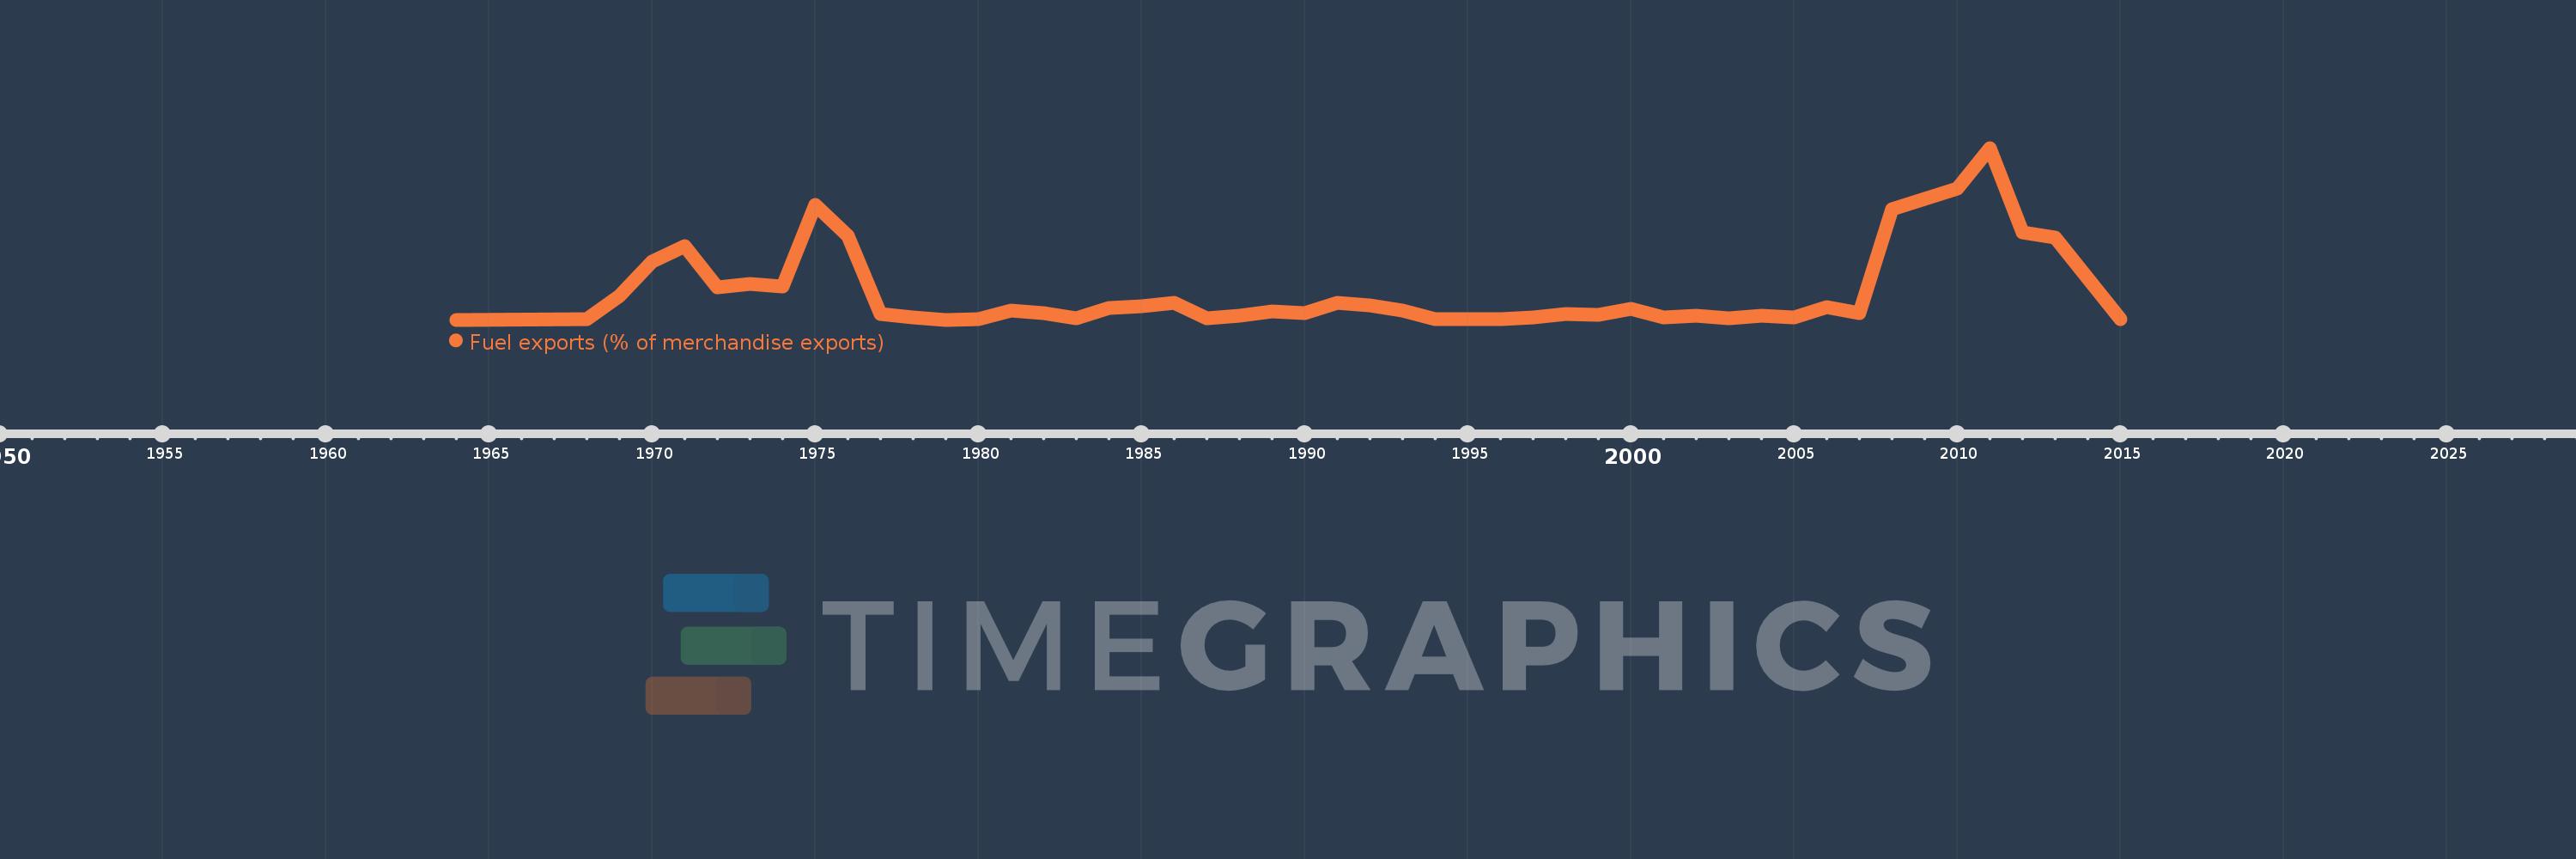
Fuel exports (% of merchandise exports)
2015,2013,2012,2011,2010,2008,2007,2006,2005,2004,2003,2002,2001,2000,1999,1998,1997,1996,1995,1994,1993,1992,1991,1990,1989,1988,1987,1986,1985,1984,1983,1982,1981,1980,1979,1978,1977,1976,1975,1974,1973,1972,1971,1970,1969,1968,1964
Estas estadísticas en otros países:
AfghanistanAlbaniaAlgeriaAndorraAngolaAntigua and BarbudaArab WorldArgentinaArmeniaArubaAustraliaAustriaAzerbaijanBahamas, TheBahrainBangladeshBarbadosBelarusBelgiumBelizeBeninBermudaBhutanBoliviaBosnia and HerzegovinaBotswanaBrazilBrunei DarussalamBulgariaBurkina FasoBurundiCabo VerdeCambodiaCameroonCanadaCaribbean small statesCayman IslandsCentral African RepublicCentral Europe and the BalticsChadChileChinaColombiaComorosCongo, Dem. Rep.Congo, Rep.Costa RicaCote d'IvoireCroatiaCubaCyprusCzech RepublicDenmarkDjiboutiDominicaDominican RepublicEarly-demographic dividendEast Asia & PacificEast Asia & Pacific (excluding high income)East Asia & Pacific (IDA & IBRD countries)EcuadorEgypt, Arab Rep.El SalvadorEquatorial GuineaEritreaEstoniaEthiopiaEuro areaEurope & Central AsiaEurope & Central Asia (excluding high income)Europe & Central Asia (IDA & IBRD countries)European UnionFaroe IslandsFijiFinlandFragile and conflict affected situationsFranceFrench PolynesiaGabonGambia, TheGeorgiaGermanyGhanaGreeceGreenlandGrenadaGuatemalaGuineaGuinea-BissauGuyanaHaitiHeavily indebted poor countries (HIPC)High incomeHondurasHong Kong SAR, ChinaHungaryIBRD onlyIcelandIDA & IBRD totalIDA blendIDA onlyIDA totalIndiaIndonesiaIran, Islamic Rep.IraqIrelandIsraelItalyJamaicaJapanJordanKazakhstanKenyaKiribatiKorea, Rep.KuwaitKyrgyz RepublicLao PDRLate-demographic dividendLatin America & Caribbean Latin America & Caribbean (excluding high income)Latin America & the Caribbean (IDA & IBRD countries)LatviaLeast developed countries: UN classificationLebanonLesothoLiberiaLibyaLithuaniaLow & middle incomeLower middle incomeLuxembourgMacao SAR, ChinaMacedonia, FYRMadagascarMalawiMalaysiaMaldivesMaliMaltaMauritaniaMauritiusMexicoMiddle East & North AfricaMiddle East & North Africa (excluding high income)Middle East & North Africa (IDA & IBRD countries)Middle incomeMoldovaMongoliaMoroccoMozambiqueMyanmarNamibiaNepalNetherlandsNew CaledoniaNew ZealandNicaraguaNigerNigeriaNorth AmericaNorwayOECD membersOmanOther small statesPacific island small statesPakistanPalauPanamaPapua New GuineaParaguayPeruPhilippinesPolandPortugalPost-demographic dividendPre-demographic dividendQatarRomaniaRussian FederationRwandaSamoaSao Tome and PrincipeSaudi ArabiaSenegalSerbiaSeychellesSierra LeoneSingaporeSlovak RepublicSloveniaSmall statesSolomon IslandsSomaliaSouth AfricaSouth AsiaSouth Asia (IDA & IBRD)SpainSri LankaSt. Kitts and NevisSt. LuciaSt. Vincent and the GrenadinesSub-Saharan Africa Sub-Saharan Africa (excluding high income)Sub-Saharan Africa (IDA & IBRD countries)SudanSurinameSwazilandSwedenSwitzerlandSyrian Arab RepublicTajikistanTanzaniaThailandTimor-LesteTogoTongaTrinidad and TobagoTunisiaTurkeyTurkmenistanTurks and Caicos IslandsTuvaluUgandaUkraineUnited Arab EmiratesUnited KingdomUnited StatesUpper middle incomeUruguayVanuatuVenezuela, RBVietnamVirgin Islands (U.S.)WorldYemen, Rep.ZambiaZimbabwe línea de tiempo (timeline):
En esta escala de tiempo se presenta un gráfico de 1964 y 2015 de Honduras. Los datos de 1963 están ausentes. El número de observaciones reales por fecha: 47.
Fuente (nombre):
Indicadores del desarrollo mundial
Fuente (organización):
World Bank staff estimates from the Comtrade database maintained by the United Nations Statistics Division.
Categorías:
Energy & Mining, Private Sector, Trade
Se ha actualizado:
23 abr 2017 año
Los indicadores de los cambios de valor en los últimos años
Máximo:
8.562
1 ene 2011 año
A la fecha de observación
Valor
Cambio absoluto
El cambio con respecto al valor anterior
1 ene 1964 año
0.0
+0.0
0.0%
1 ene 1968 año
0.021
+0.021
1.74 millones%
1 ene 1969 año
1.172
+1.15
5.41 mil%
1 ene 1970 año
2.888
+1.717
146.54%
1 ene 1971 año
3.69
+0.801
27.75%
1 ene 1972 año
1.635
-2.055
-55.68%
1 ene 1973 año
1.78
+0.144
8.83%
1 ene 1974 año
1.675
-0.105
-5.88%
1 ene 1975 año
5.726
+4.051
241.85%
1 ene 1976 año
4.183
-1.543
-26.95%
1 ene 1977 año
0.29
-3.893
-93.07%
1 ene 1978 año
0.119
-0.17
-58.79%
1 ene 1979 año
0.0
-0.119
-100.0%
1 ene 1980 año
0.041
+0.041
1.02 millones%
1 ene 1981 año
0.473
+0.432
1.07 mil%
1 ene 1982 año
0.336
-0.137
-28.95%
1 ene 1983 año
0.089
-0.247
-73.58%
1 ene 1984 año
0.599
+0.511
575.24%
1 ene 1985 año
0.666
+0.067
11.18%
1 ene 1986 año
0.85
+0.184
27.63%
1 ene 1987 año
0.056
-0.795
-93.47%
1 ene 1988 año
0.217
+0.161
290.62%
1 ene 1989 año
0.402
+0.186
85.62%
1 ene 1990 año
0.327
-0.075
-18.7%
1 ene 1991 año
0.85
+0.523
159.9%
1 ene 1992 año
0.72
-0.13
-15.33%
1 ene 1993 año
0.476
-0.244
-33.94%
1 ene 1994 año
0.011
-0.465
-97.77%
1 ene 1995 año
0.022
+0.011
104.65%
1 ene 1996 año
0.021
-0.001
-3.17%
1 ene 1997 año
0.11
+0.089
421.87%
1 ene 1998 año
0.283
+0.173
157.78%
1 ene 1999 año
0.256
-0.027
-9.43%
1 ene 2000 año
0.532
+0.276
107.61%
1 ene 2001 año
0.113
-0.418
-78.7%
1 ene 2002 año
0.185
+0.072
63.27%
1 ene 2003 año
0.067
-0.118
-63.89%
1 ene 2004 año
0.21
+0.143
214.74%
1 ene 2005 año
0.105
-0.105
-50.18%
1 ene 2006 año
0.625
+0.521
497.22%
1 ene 2007 año
0.351
-0.275
-43.94%
1 ene 2008 año
5.522
+5.172
1.48 mil%
1 ene 2010 año
6.555
+1.033
18.7%
1 ene 2011 año
8.562
+2.007
30.61%
1 ene 2012 año
4.371
-4.191
-48.95%
1 ene 2013 año
4.091
-0.28
-6.41%
1 ene 2015 año
0.045
-4.045
-98.89%
Ranking de los países por los datos estadísticos actuales


Comentarios: