29
/es/
es
AIzaSyAYiBZKx7MnpbEhh9jyipgxe19OcubqV5w
April 1, 2024
146380
Guinea
GIN
true
2
1
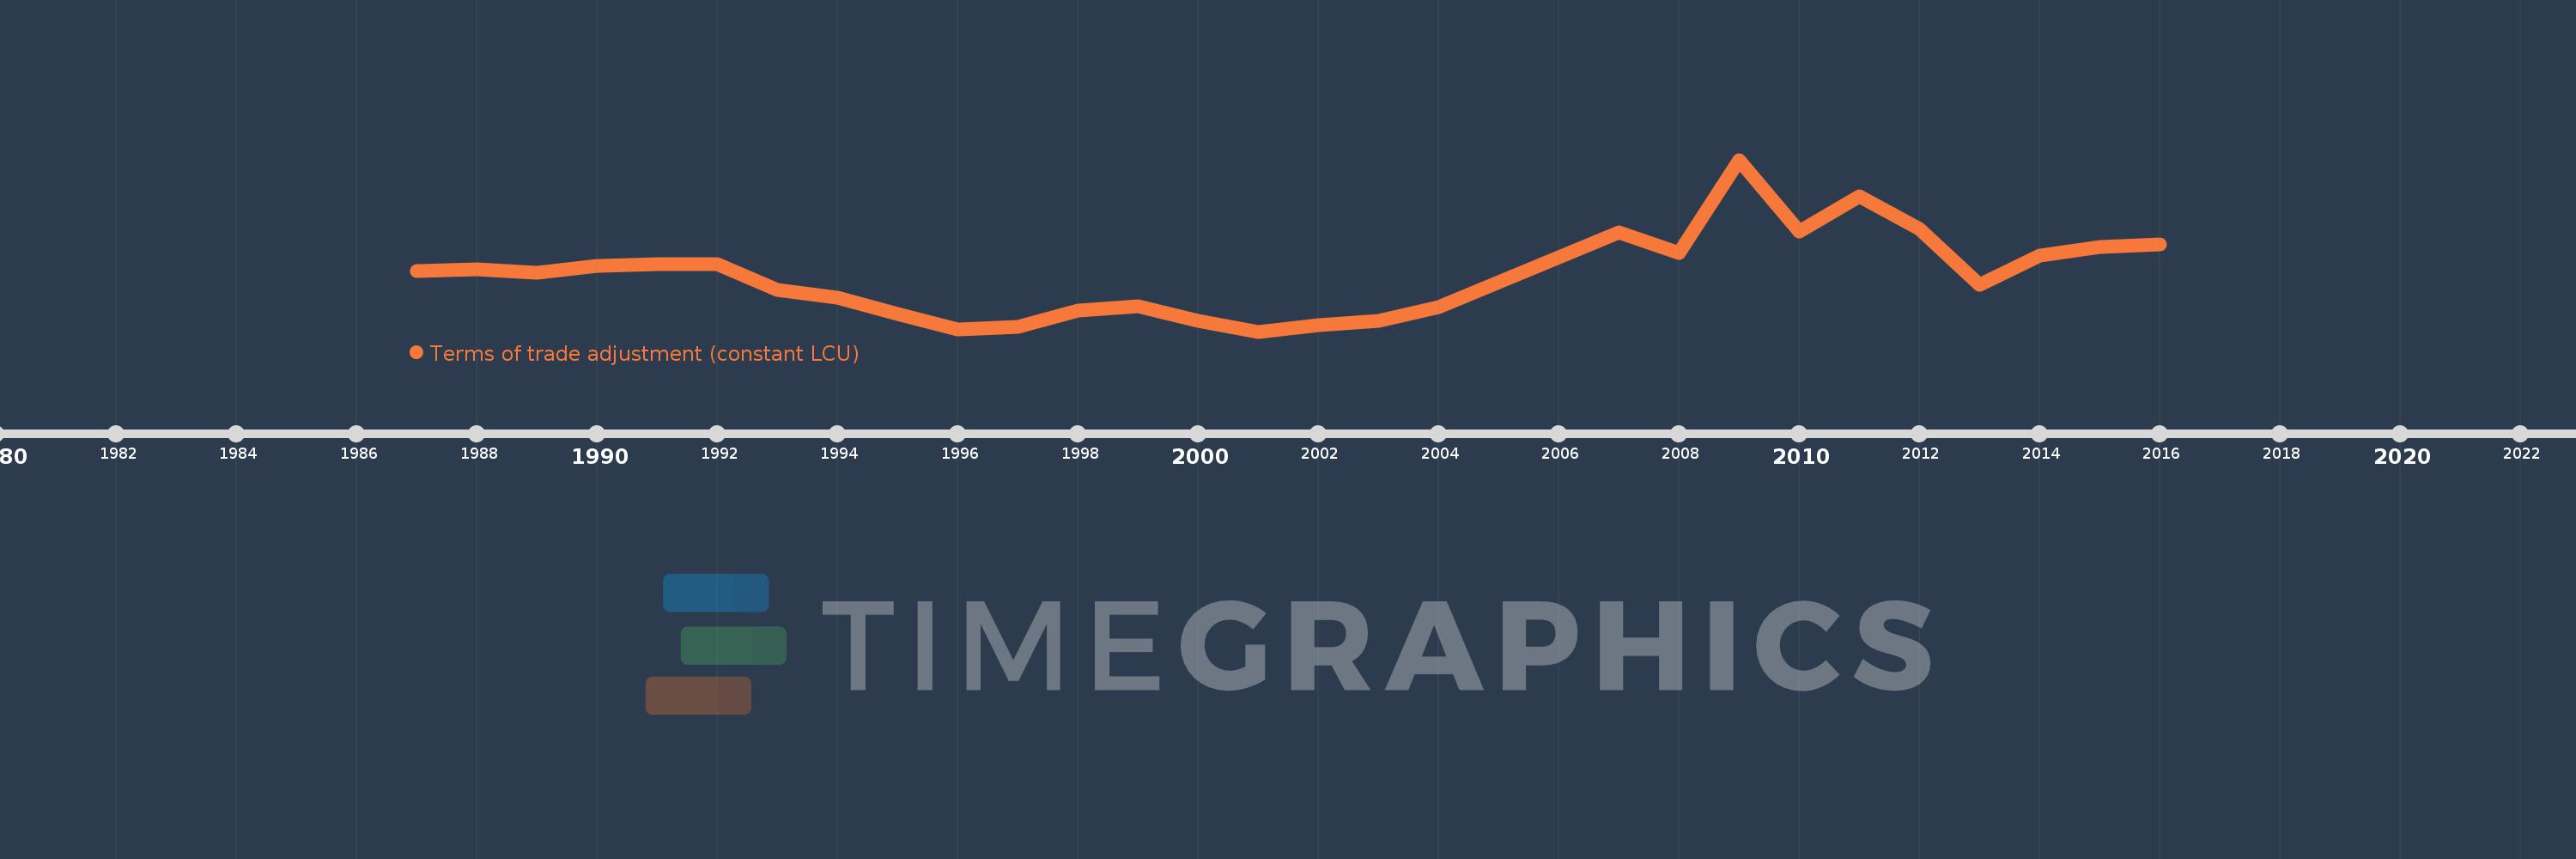
Terms of trade adjustment (constant LCU)
2016,2015,2014,2013,2012,2011,2010,2009,2008,2007,2004,2003,2002,2001,2000,1999,1998,1997,1996,1995,1994,1993,1992,1991,1990,1989,1988,1987
Estas estadísticas en otros países:
AlbaniaAlgeriaAngolaAntigua and BarbudaArgentinaArmeniaAustraliaAustriaAzerbaijanBahamas, TheBahrainBangladeshBarbadosBelarusBelgiumBelizeBeninBhutanBoliviaBosnia and HerzegovinaBotswanaBrazilBrunei DarussalamBulgariaBurkina FasoBurundiCabo VerdeCambodiaCameroonCanadaChadChileColombiaComorosCongo, Dem. Rep.Congo, Rep.Costa RicaCote d'IvoireCroatiaCubaCyprusCzech RepublicDenmarkDjiboutiDominican RepublicEcuadorEgypt, Arab Rep.El SalvadorEquatorial GuineaEritreaEstoniaEthiopiaFijiFinlandFranceGabonGambia, TheGeorgiaGermanyGhanaGreeceGuatemalaGuineaGuinea-BissauHaitiHondurasHong Kong SAR, ChinaHungaryIcelandIndiaIndonesiaIran, Islamic Rep.IrelandIsraelItalyJamaicaJapanJordanKazakhstanKenyaKorea, Rep.KosovoKuwaitKyrgyz RepublicLao PDRLatviaLebanonLiberiaLibyaLithuaniaLuxembourgMacao SAR, ChinaMacedonia, FYRMadagascarMalawiMalaysiaMaliMaltaMauritaniaMauritiusMexicoMoldovaMongoliaMontenegroMoroccoMozambiqueMyanmarNamibiaNepalNetherlandsNew ZealandNicaraguaNigerNigeriaNorwayOmanPakistanPanamaPapua New GuineaParaguayPeruPhilippinesPolandPortugalPuerto RicoQatarRomaniaRussian FederationRwandaSamoaSaudi ArabiaSenegalSerbiaSeychellesSierra LeoneSingaporeSlovak RepublicSloveniaSomaliaSouth AfricaSouth SudanSpainSri LankaSudanSurinameSwazilandSwedenSwitzerlandSyrian Arab RepublicTajikistanTanzaniaThailandTimor-LesteTogoTrinidad and TobagoTunisiaTurkeyTurkmenistanUgandaUkraineUnited Arab EmiratesUnited KingdomUnited StatesUruguayUzbekistanVanuatuVenezuela, RBVietnamWest Bank and GazaZambiaZimbabwe línea de tiempo (timeline):
En esta escala de tiempo se presenta un gráfico de 1987 y 2016 de Guinea. Los datos de 1986 están ausentes. El número de observaciones reales por fecha: 28.
Fuente (nombre):
Indicadores del desarrollo mundial
Fuente (organización):
World Bank national accounts data, and OECD National Accounts data files.
Categorías:
Economy & Growth
Se ha actualizado:
23 abr 2017 año
Los indicadores de los cambios de valor en los últimos años
Mínimo:
-238.233 bn
1 ene 2001 año
Máximo:
1.411 billones
1 ene 2009 año
A la fecha de observación
Valor
Cambio absoluto
El cambio con respecto al valor anterior
1 ene 1987 año
343.331 bn
+343.331 bn
0.0%
1 ene 1988 año
360.814 bn
+17.483 bn
5.09%
1 ene 1989 año
325.868 bn
-34.946 bn
-9.69%
1 ene 1990 año
392.148 bn
+66.281 bn
20.34%
1 ene 1991 año
408.864 bn
+16.715 bn
4.26%
1 ene 1992 año
409.5 bn
+636.017 millones
0.16%
1 ene 1993 año
163.151 bn
-246.348 bn
-60.16%
1 ene 1994 año
84.77 bn
-78.381 bn
-48.04%
1 ene 1995 año
-66.672 bn
-151.442 bn
-178.65%
1 ene 1996 año
-214.93 bn
-148.259 bn
222.37%
1 ene 1997 año
-194.332 bn
+20.599 bn
-9.58%
1 ene 1998 año
-37.895 bn
+156.437 bn
-80.5%
1 ene 1999 año
2.648 bn
+40.543 bn
-106.99%
1 ene 2000 año
-137.287 bn
-139.935 bn
-5.28 mil%
1 ene 2001 año
-238.233 bn
-100.946 bn
73.53%
1 ene 2002 año
-177.275 bn
+60.958 bn
-25.59%
1 ene 2003 año
-131.734 bn
+45.54 bn
-25.69%
1 ene 2004 año
0.0
+131.734 bn
-100.0%
1 ene 2007 año
711.103 bn
+711.103 bn
%
1 ene 2008 año
517.928 bn
-193.175 bn
-27.17%
1 ene 2009 año
1.411 billones
+892.787 bn
172.38%
1 ene 2010 año
719.52 bn
-691.195 bn
-49.0%
1 ene 2011 año
1.061 billones
+341.638 bn
47.48%
1 ene 2012 año
749.991 bn
-311.167 bn
-29.32%
1 ene 2013 año
209.348 bn
-540.643 bn
-72.09%
1 ene 2014 año
488.798 bn
+279.45 bn
133.49%
1 ene 2015 año
575.659 bn
+86.861 bn
17.77%
1 ene 2016 año
600.637 bn
+24.978 bn
4.34%
Ranking de los países por los datos estadísticos actuales


Comentarios: