29
/es/
es
AIzaSyAYiBZKx7MnpbEhh9jyipgxe19OcubqV5w
April 1, 2024
143809
Guam
GUM
true
2
1
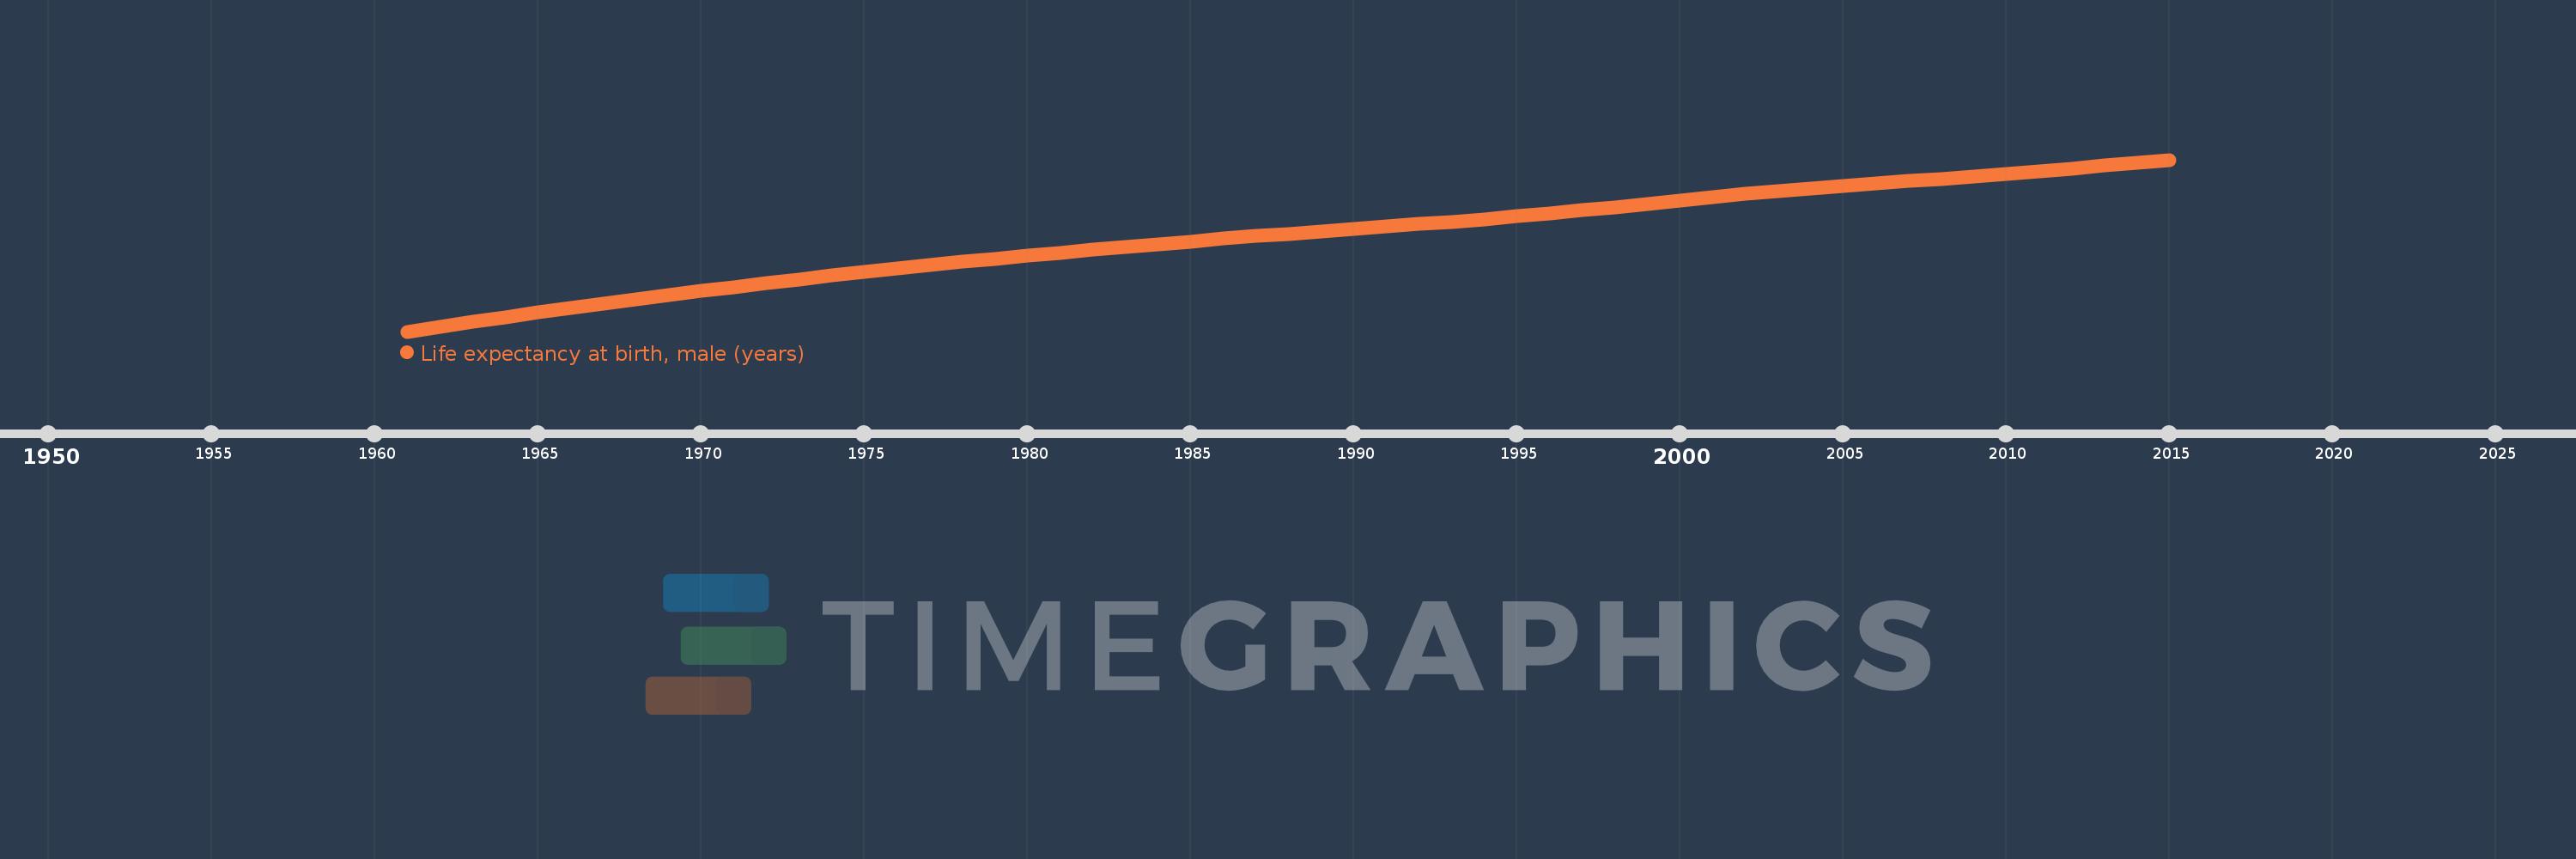
Life expectancy at birth, male (years)
2015,2014,2013,2012,2011,2010,2009,2008,2007,2006,2005,2004,2003,2002,2001,2000,1999,1998,1997,1996,1995,1994,1993,1992,1991,1990,1989,1988,1987,1986,1985,1984,1983,1982,1981,1980,1979,1978,1977,1976,1975,1974,1973,1972,1971,1970,1969,1968,1967,1966,1965,1964,1963,1962,1961
Estas estadísticas en otros países:
AfghanistanAlbaniaAlgeriaAngolaAntigua and BarbudaArab WorldArgentinaArmeniaArubaAustraliaAustriaAzerbaijanBahamas, TheBahrainBangladeshBarbadosBelarusBelgiumBelizeBeninBermudaBhutanBoliviaBosnia and HerzegovinaBotswanaBrazilBrunei DarussalamBulgariaBurkina FasoBurundiCabo VerdeCambodiaCameroonCanadaCaribbean small statesCentral African RepublicCentral Europe and the BalticsChadChannel IslandsChileChinaColombiaComorosCongo, Dem. Rep.Congo, Rep.Costa RicaCote d'IvoireCroatiaCubaCuracaoCyprusCzech RepublicDenmarkDjiboutiDominicaDominican RepublicEarly-demographic dividendEast Asia & PacificEast Asia & Pacific (excluding high income)East Asia & Pacific (IDA & IBRD countries)EcuadorEgypt, Arab Rep.El SalvadorEquatorial GuineaEritreaEstoniaEthiopiaEuro areaEurope & Central AsiaEurope & Central Asia (excluding high income)Europe & Central Asia (IDA & IBRD countries)European UnionFaroe IslandsFijiFinlandFragile and conflict affected situationsFranceFrench PolynesiaGabonGambia, TheGeorgiaGermanyGhanaGreeceGreenlandGrenadaGuamGuatemalaGuineaGuinea-BissauGuyanaHaitiHeavily indebted poor countries (HIPC)High incomeHondurasHong Kong SAR, ChinaHungaryIBRD onlyIcelandIDA & IBRD totalIDA blendIDA onlyIDA totalIndiaIndonesiaIran, Islamic Rep.IraqIrelandIsle of ManIsraelItalyJamaicaJapanJordanKazakhstanKenyaKiribatiKorea, Dem. People’s Rep.Korea, Rep.KosovoKuwaitKyrgyz RepublicLao PDRLate-demographic dividendLatin America & Caribbean Latin America & Caribbean (excluding high income)Latin America & the Caribbean (IDA & IBRD countries)LatviaLeast developed countries: UN classificationLebanonLesothoLiberiaLibyaLiechtensteinLithuaniaLow & middle incomeLow incomeLower middle incomeLuxembourgMacao SAR, ChinaMacedonia, FYRMadagascarMalawiMalaysiaMaldivesMaliMaltaMarshall IslandsMauritaniaMauritiusMexicoMicronesia, Fed. Sts.Middle East & North AfricaMiddle East & North Africa (excluding high income)Middle East & North Africa (IDA & IBRD countries)Middle incomeMoldovaMongoliaMontenegroMoroccoMozambiqueMyanmarNamibiaNepalNetherlandsNew CaledoniaNew ZealandNicaraguaNigerNigeriaNorth AmericaNorwayOECD membersOmanOther small statesPacific island small statesPakistanPalauPanamaPapua New GuineaParaguayPeruPhilippinesPolandPortugalPost-demographic dividendPre-demographic dividendPuerto RicoQatarRomaniaRussian FederationRwandaSamoaSan MarinoSao Tome and PrincipeSaudi ArabiaSenegalSerbiaSeychellesSierra LeoneSingaporeSint Maarten (Dutch part)Slovak RepublicSloveniaSmall statesSolomon IslandsSomaliaSouth AfricaSouth AsiaSouth Asia (IDA & IBRD)South SudanSpainSri LankaSt. Kitts and NevisSt. LuciaSt. Martin (French part)St. Vincent and the GrenadinesSub-Saharan Africa Sub-Saharan Africa (excluding high income)Sub-Saharan Africa (IDA & IBRD countries)SudanSurinameSwazilandSwedenSwitzerlandSyrian Arab RepublicTajikistanTanzaniaThailandTimor-LesteTogoTongaTrinidad and TobagoTunisiaTurkeyTurkmenistanUgandaUkraineUnited Arab EmiratesUnited KingdomUnited StatesUpper middle incomeUruguayUzbekistanVanuatuVenezuela, RBVietnamVirgin Islands (U.S.)West Bank and GazaWorldYemen, Rep.ZambiaZimbabwe línea de tiempo (timeline):
En esta escala de tiempo se presenta un gráfico de 1961 y 2015 de Guam. Los datos de 1960 están ausentes. El número de observaciones reales por fecha: 55.
Fuente (nombre):
Indicadores del desarrollo mundial
Fuente (organización):
(1) United Nations Population Division. World Population Prospects, (2) Census reports and other statistical publications from national statistical offices, (3) Eurostat: Demographic Statistics, (4) United Nations Statistical Division. Population and Vital Statistics Reprot (various years), (5) U.S. Census Bureau: International Database, and (6) Secretariat of the Pacific Community: Statistics and Demography Programme.
Categorías:
Health, Gender, Social Development
Se ha actualizado:
23 abr 2017 año
Los indicadores de los cambios de valor en los últimos años
Mínimo:
59.12
1 ene 1961 año
Máximo:
76.567
1 ene 2015 año
A la fecha de observación
Valor
Cambio absoluto
El cambio con respecto al valor anterior
1 ene 1961 año
59.12
+59.12
0.0%
1 ene 1962 año
59.617
+0.497
0.84%
1 ene 1963 año
60.107
+0.49
0.82%
1 ene 1964 año
60.587
+0.48
0.8%
1 ene 1965 año
61.056
+0.469
0.77%
1 ene 1966 año
61.514
+0.458
0.75%
1 ene 1967 año
61.96
+0.446
0.73%
1 ene 1968 año
62.395
+0.435
0.7%
1 ene 1969 año
62.82
+0.425
0.68%
1 ene 1970 año
63.235
+0.415
0.66%
1 ene 1971 año
63.64
+0.405
0.64%
1 ene 1972 año
64.035
+0.395
0.62%
1 ene 1973 año
64.42
+0.385
0.6%
1 ene 1974 año
64.795
+0.375
0.58%
1 ene 1975 año
65.16
+0.365
0.56%
1 ene 1976 año
65.515
+0.355
0.54%
1 ene 1977 año
65.859
+0.344
0.53%
1 ene 1978 año
66.192
+0.333
0.51%
1 ene 1979 año
66.515
+0.323
0.49%
1 ene 1980 año
66.828
+0.313
0.47%
1 ene 1981 año
67.132
+0.304
0.45%
1 ene 1982 año
67.428
+0.296
0.44%
1 ene 1983 año
67.717
+0.289
0.43%
1 ene 1984 año
68.0
+0.283
0.42%
1 ene 1985 año
68.277
+0.277
0.41%
1 ene 1986 año
68.548
+0.271
0.4%
1 ene 1987 año
68.81
+0.262
0.38%
1 ene 1988 año
69.063
+0.253
0.37%
1 ene 1989 año
69.308
+0.245
0.35%
1 ene 1990 año
69.548
+0.24
0.35%
1 ene 1991 año
69.788
+0.24
0.35%
1 ene 1992 año
70.032
+0.244
0.35%
1 ene 1993 año
70.283
+0.251
0.36%
1 ene 1994 año
70.546
+0.263
0.37%
1 ene 1995 año
70.822
+0.276
0.39%
1 ene 1996 año
71.114
+0.292
0.41%
1 ene 1997 año
71.426
+0.312
0.44%
1 ene 1998 año
71.754
+0.328
0.46%
1 ene 1999 año
72.094
+0.34
0.47%
1 ene 2000 año
72.438
+0.344
0.48%
1 ene 2001 año
72.779
+0.341
0.47%
1 ene 2002 año
73.103
+0.324
0.45%
1 ene 2003 año
73.405
+0.302
0.41%
1 ene 2004 año
73.682
+0.277
0.38%
1 ene 2005 año
73.935
+0.253
0.34%
1 ene 2006 año
74.169
+0.234
0.32%
1 ene 2007 año
74.395
+0.226
0.3%
1 ene 2008 año
74.624
+0.229
0.31%
1 ene 2009 año
74.865
+0.241
0.32%
1 ene 2010 año
75.122
+0.257
0.34%
1 ene 2011 año
75.396
+0.274
0.36%
1 ene 2012 año
75.683
+0.287
0.38%
1 ene 2013 año
75.978
+0.295
0.39%
1 ene 2014 año
76.273
+0.295
0.39%
1 ene 2015 año
76.567
+0.294
0.39%
Ranking de los países por los datos estadísticos actuales


Comentarios: