29
/es/
es
AIzaSyAYiBZKx7MnpbEhh9jyipgxe19OcubqV5w
April 1, 2024
140101
Ghana
GHA
true
2
1
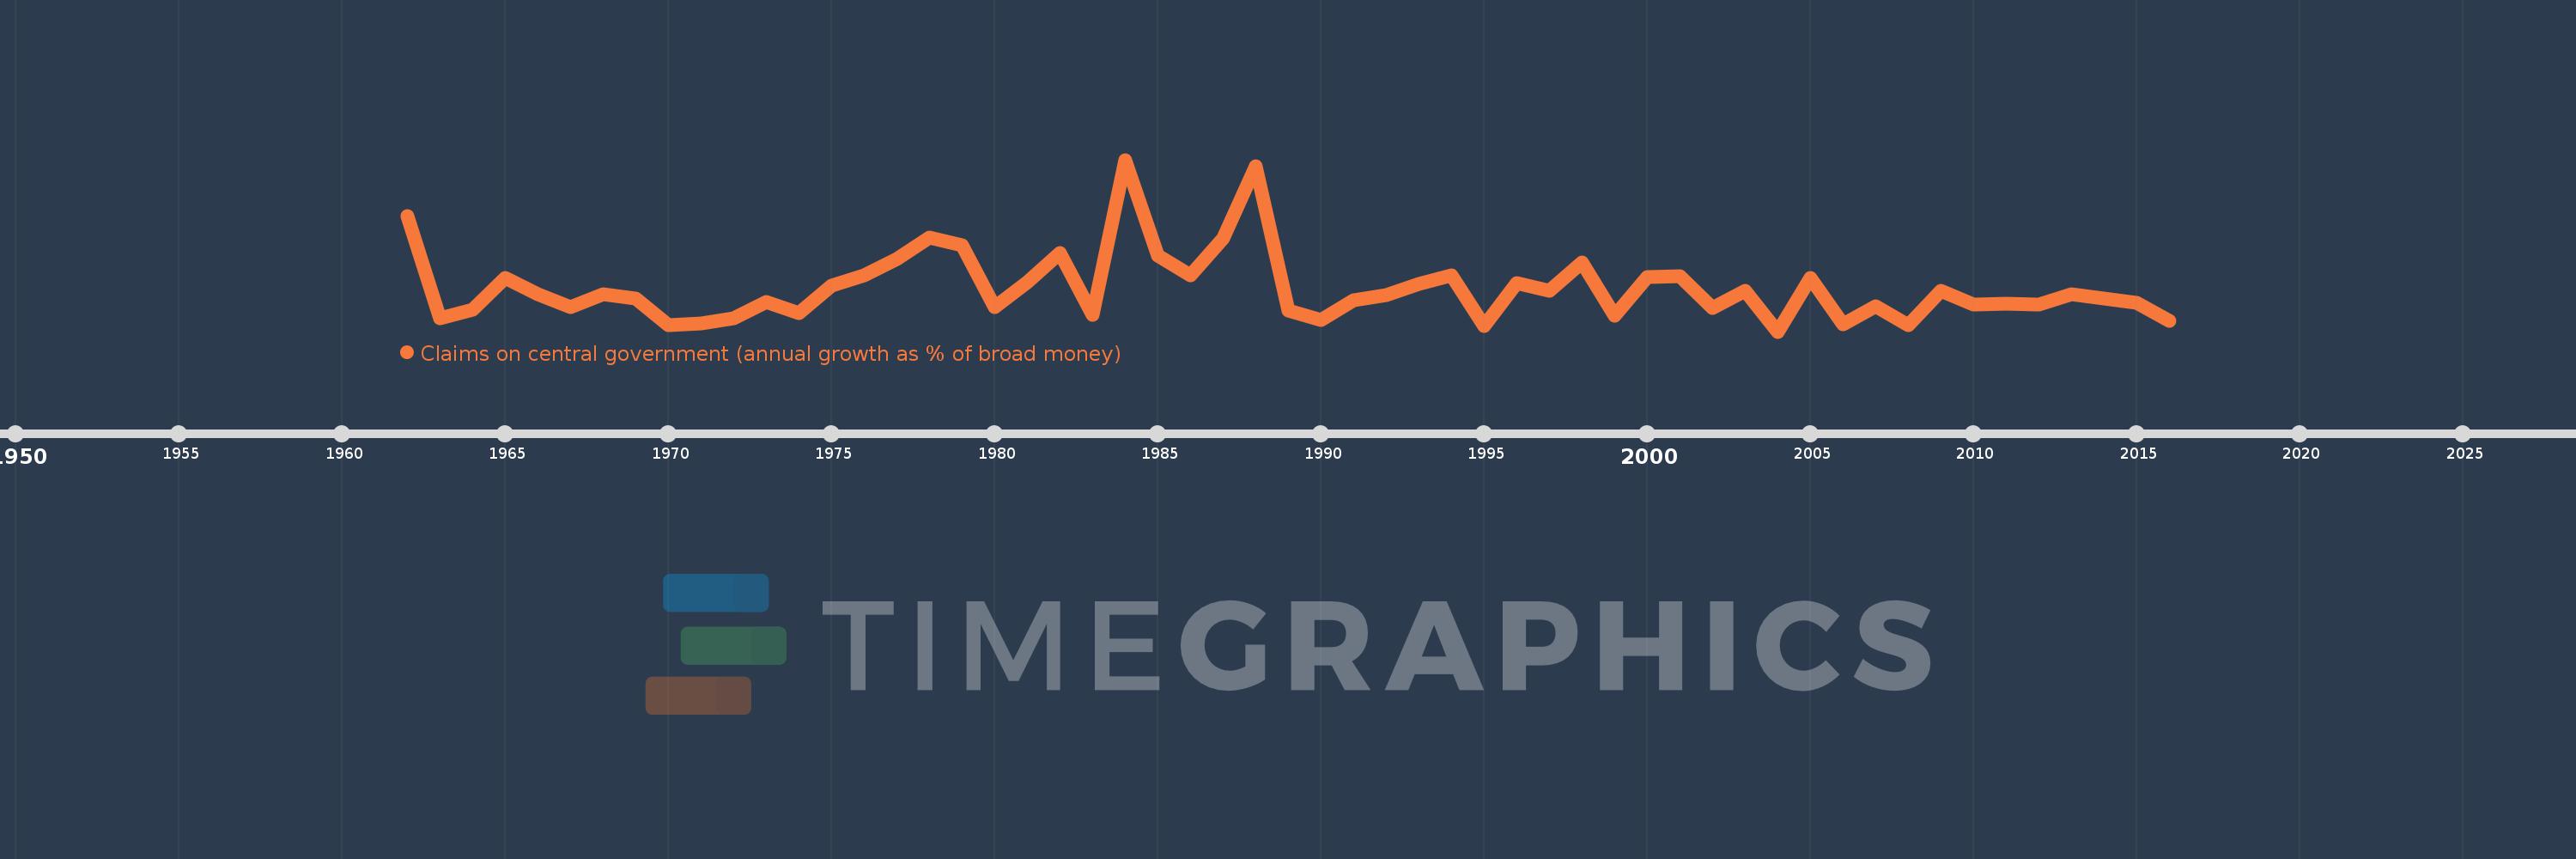
Claims on central government (annual growth as % of broad money)
2016,2015,2014,2013,2012,2011,2010,2009,2008,2007,2006,2005,2004,2003,2002,2001,2000,1999,1998,1997,1996,1995,1994,1993,1992,1991,1990,1989,1988,1987,1986,1985,1984,1983,1982,1981,1980,1979,1978,1977,1976,1975,1974,1973,1972,1971,1970,1969,1968,1967,1966,1965,1964,1963,1962
Estas estadísticas en otros países:
AfghanistanAlbaniaAlgeriaAngolaAntigua and BarbudaArgentinaArmeniaArubaAustraliaAzerbaijanBahamas, TheBahrainBangladeshBarbadosBelarusBelizeBeninBhutanBoliviaBosnia and HerzegovinaBotswanaBrazilBrunei DarussalamBulgariaBurkina FasoBurundiCabo VerdeCambodiaCameroonCanadaCentral African RepublicChadChileChinaColombiaComorosCongo, Dem. Rep.Congo, Rep.Costa RicaCote d'IvoireCroatiaCzech RepublicDenmarkDjiboutiDominicaDominican RepublicEcuadorEgypt, Arab Rep.El SalvadorEquatorial GuineaEritreaEstoniaEthiopiaFijiGabonGambia, TheGeorgiaGhanaGrenadaGuatemalaGuineaGuinea-BissauGuyanaHaitiHondurasHong Kong SAR, ChinaHungaryIcelandIndiaIndonesiaIran, Islamic Rep.IraqIsraelJamaicaJapanJordanKazakhstanKenyaKorea, Rep.KuwaitKyrgyz RepublicLao PDRLatviaLebanonLesothoLiberiaLibyaLithuaniaMacao SAR, ChinaMacedonia, FYRMadagascarMalawiMalaysiaMaldivesMaliMauritaniaMauritiusMexicoMicronesia, Fed. Sts.MoldovaMongoliaMoroccoMozambiqueMyanmarNamibiaNepalNew ZealandNicaraguaNigerNigeriaNorwayOmanPakistanPanamaPapua New GuineaParaguayPeruPhilippinesPolandQatarRomaniaRussian FederationRwandaSamoaSao Tome and PrincipeSaudi ArabiaSenegalSerbiaSeychellesSierra LeoneSingaporeSlovak RepublicSolomon IslandsSouth AfricaSouth SudanSri LankaSt. Kitts and NevisSt. LuciaSt. Vincent and the GrenadinesSudanSurinameSwazilandSwedenSwitzerlandSyrian Arab RepublicTajikistanTanzaniaThailandTimor-LesteTogoTongaTrinidad and TobagoTunisiaTurkeyUgandaUkraineUnited Arab EmiratesUnited KingdomUnited StatesUruguayVanuatuVenezuela, RBVietnamWest Bank and GazaYemen, Rep.ZambiaZimbabwe línea de tiempo (timeline):
En esta escala de tiempo se presenta un gráfico de 1962 y 2016 de Ghana. Los datos de 1961 están ausentes. El número de observaciones reales por fecha: 55.
Fuente (nombre):
Indicadores del desarrollo mundial
Fuente (organización):
International Monetary Fund, International Financial Statistics and data files.
Categorías:
Financial Sector
Se ha actualizado:
23 abr 2017 año
Los indicadores de los cambios de valor en los últimos años
Mínimo:
-9.943
1 ene 2004 año
Máximo:
124.036
1 ene 1984 año
A la fecha de observación
Valor
Cambio absoluto
El cambio con respecto al valor anterior
1 ene 1962 año
80.488
+80.488
0.0%
1 ene 1963 año
0.287
-80.2
-99.64%
1 ene 1964 año
6.936
+6.649
2.31 mil%
1 ene 1965 año
32.0
+25.064
361.35%
1 ene 1966 año
19.132
-12.868
-40.21%
1 ene 1967 año
8.885
-10.246
-53.56%
1 ene 1968 año
19.376
+10.491
118.07%
1 ene 1969 año
15.518
-3.858
-19.91%
1 ene 1970 año
-4.882
-20.4
-131.46%
1 ene 1971 año
-3.435
+1.447
-29.64%
1 ene 1972 año
0.319
+3.754
-109.3%
1 ene 1973 año
12.875
+12.556
3.93 mil%
1 ene 1974 año
4.313
-8.563
-66.51%
1 ene 1975 año
26.191
+21.879
507.33%
1 ene 1976 año
33.874
+7.683
29.33%
1 ene 1977 año
46.804
+12.929
38.17%
1 ene 1978 año
63.662
+16.859
36.02%
1 ene 1979 año
57.106
-6.556
-10.3%
1 ene 1980 año
9.27
-47.836
-83.77%
1 ene 1981 año
28.46
+19.19
207.01%
1 ene 1982 año
51.412
+22.952
80.65%
1 ene 1983 año
3.396
-48.016
-93.39%
1 ene 1984 año
124.036
+120.64
3.55 mil%
1 ene 1985 año
49.092
-74.944
-60.42%
1 ene 1986 año
34.208
-14.884
-30.32%
1 ene 1987 año
62.646
+28.438
83.13%
1 ene 1988 año
119.003
+56.356
89.96%
1 ene 1989 año
6.394
-112.608
-94.63%
1 ene 1990 año
-0.817
-7.211
-112.77%
1 ene 1991 año
14.594
+15.411
-1.89 mil%
1 ene 1992 año
18.742
+4.148
28.42%
1 ene 1993 año
27.131
+8.388
44.76%
1 ene 1994 año
33.739
+6.608
24.36%
1 ene 1995 año
-5.765
-39.504
-117.09%
1 ene 1996 año
28.121
+33.886
-587.76%
1 ene 1997 año
21.578
-6.543
-23.27%
1 ene 1998 año
43.923
+22.346
103.56%
1 ene 1999 año
2.332
-41.591
-94.69%
1 ene 2000 año
32.877
+30.545
1.31 mil%
1 ene 2001 año
32.935
+0.057
0.17%
1 ene 2002 año
8.765
-24.17
-73.39%
1 ene 2003 año
21.978
+13.213
150.76%
1 ene 2004 año
-9.943
-31.92
-145.24%
1 ene 2005 año
32.076
+42.019
-422.62%
1 ene 2006 año
-4.499
-36.576
-114.03%
1 ene 2007 año
9.74
+14.239
-316.48%
1 ene 2008 año
-4.84
-14.58
-149.69%
1 ene 2009 año
22.135
+26.974
-557.37%
1 ene 2010 año
11.295
-10.84
-48.97%
1 ene 2011 año
11.709
+0.415
3.67%
1 ene 2012 año
11.009
-0.701
-5.98%
1 ene 2013 año
18.89
+7.881
71.59%
1 ene 2014 año
16.043
-2.847
-15.07%
1 ene 2015 año
12.329
-3.714
-23.15%
1 ene 2016 año
-1.802
-14.131
-114.61%
Ranking de los países por los datos estadísticos actuales


Comentarios: