29
/es/
es
AIzaSyAYiBZKx7MnpbEhh9jyipgxe19OcubqV5w
April 1, 2024
138966
Germany
DEU
true
2
1
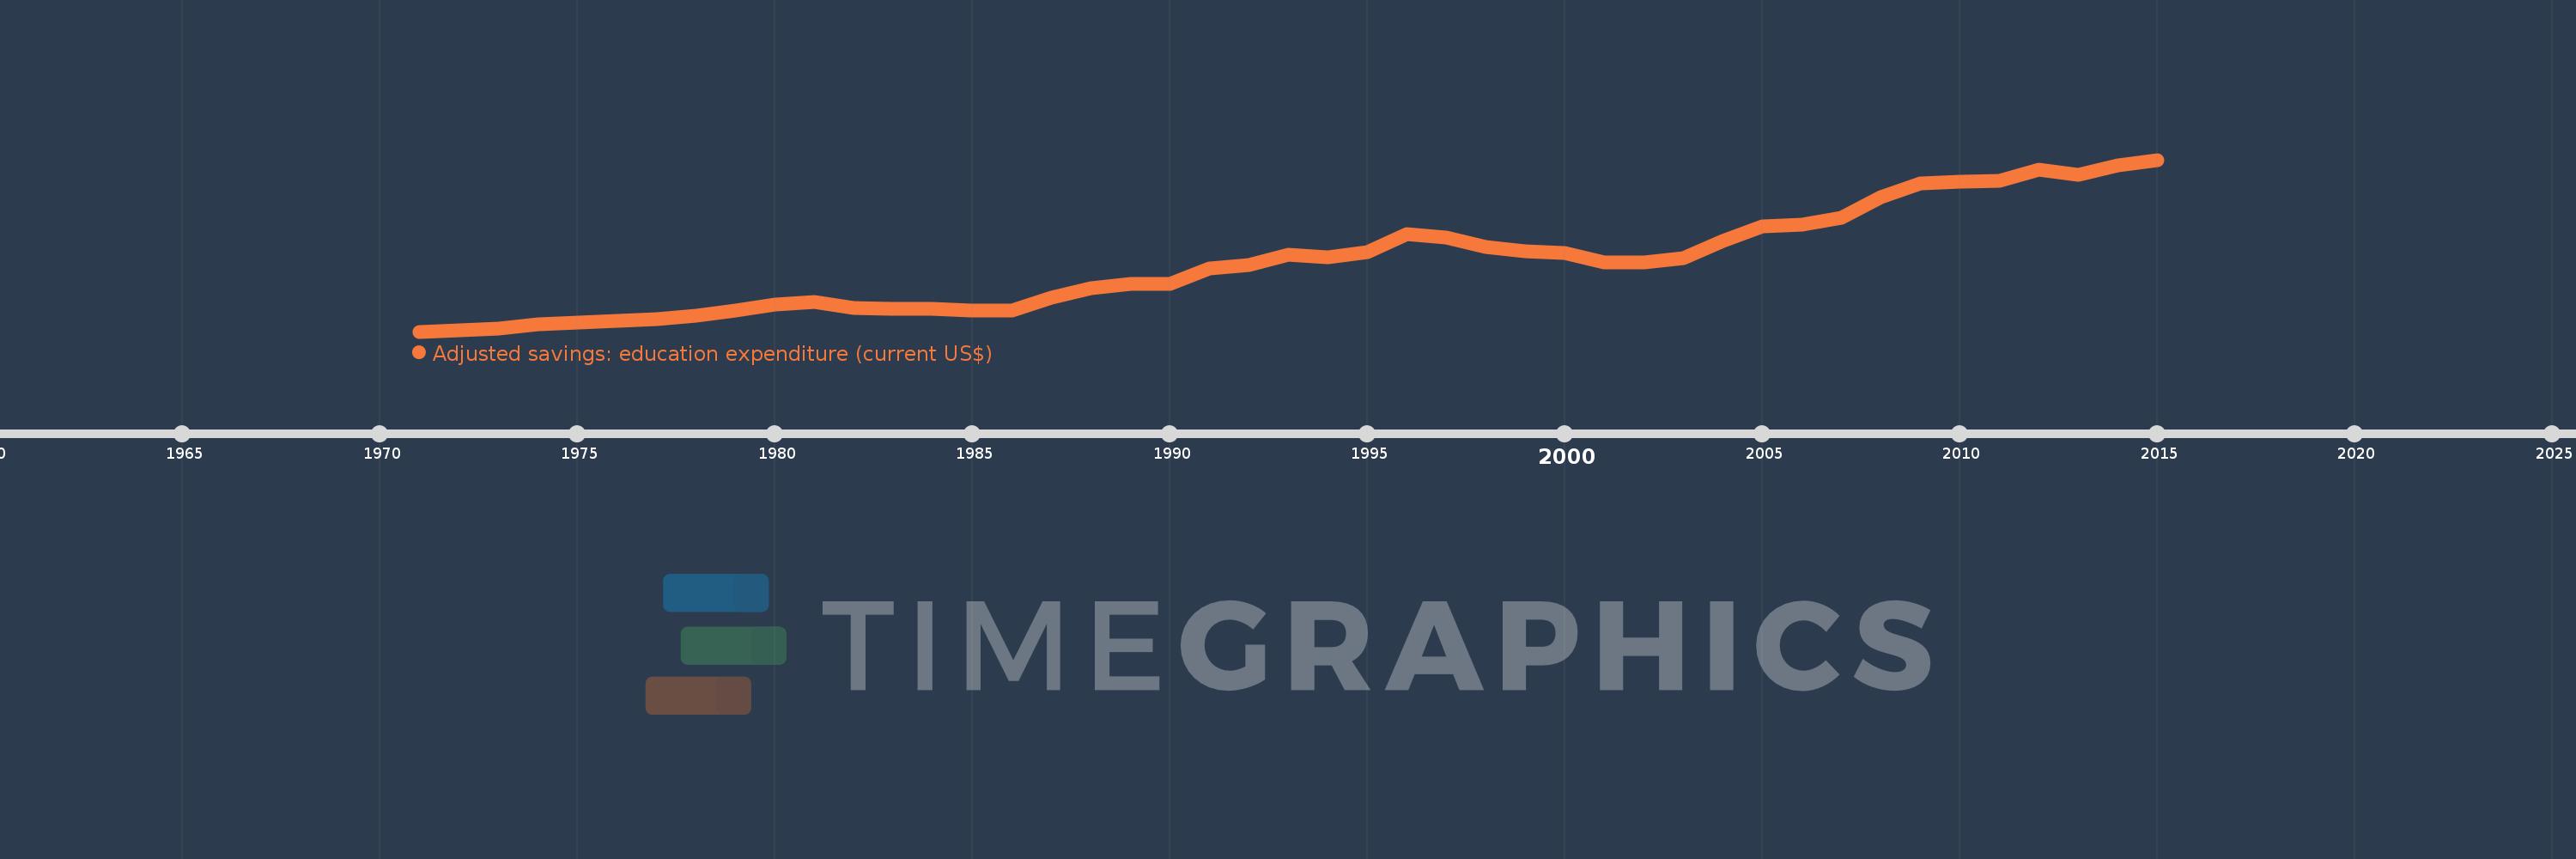
Adjusted savings: education expenditure (current US$)
2015,2014,2013,2012,2011,2010,2009,2008,2007,2006,2005,2004,2003,2002,2001,2000,1999,1998,1997,1996,1995,1994,1993,1992,1991,1990,1989,1988,1987,1986,1985,1984,1983,1982,1981,1980,1979,1978,1977,1976,1975,1974,1973,1972,1971
Estas estadísticas en otros países:
AfghanistanAlbaniaAlgeriaAmerican SamoaAndorraAngolaAntigua and BarbudaArgentinaArmeniaAustraliaAustriaAzerbaijanBahamas, TheBahrainBangladeshBarbadosBelarusBelgiumBelizeBeninBermudaBhutanBoliviaBotswanaBrazilBrunei DarussalamBulgariaBurkina FasoBurundiCabo VerdeCambodiaCameroonCanadaCentral African RepublicChadChileChinaColombiaComorosCongo, Dem. Rep.Congo, Rep.Costa RicaCote d'IvoireCroatiaCubaCyprusCzech RepublicDenmarkDjiboutiDominicaDominican RepublicEcuadorEgypt, Arab Rep.El SalvadorEquatorial GuineaEritreaEstoniaEthiopiaFijiFinlandFranceFrench PolynesiaGabonGambia, TheGeorgiaGermanyGhanaGreeceGrenadaGuatemalaGuineaGuinea-BissauGuyanaHaitiHondurasHong Kong SAR, ChinaHungaryIcelandIndiaIndonesiaIran, Islamic Rep.IraqIrelandIsraelItalyJamaicaJapanJordanKazakhstanKenyaKiribatiKorea, Rep.KuwaitKyrgyz RepublicLao PDRLatviaLebanonLesothoLiberiaLibyaLiechtensteinLithuaniaLuxembourgMacao SAR, ChinaMacedonia, FYRMadagascarMalawiMalaysiaMaldivesMaliMaltaMarshall IslandsMauritaniaMauritiusMexicoMicronesia, Fed. Sts.MoldovaMonacoMongoliaMoroccoMozambiqueMyanmarNamibiaNepalNetherlandsNew CaledoniaNew ZealandNicaraguaNigerNigeriaNorwayOmanPakistanPanamaPapua New GuineaParaguayPeruPhilippinesPolandPortugalPuerto RicoQatarRomaniaRussian FederationRwandaSamoaSan MarinoSao Tome and PrincipeSaudi ArabiaSenegalSerbiaSeychellesSierra LeoneSingaporeSlovak RepublicSloveniaSolomon IslandsSomaliaSouth AfricaSpainSri LankaSt. Kitts and NevisSt. LuciaSt. Vincent and the GrenadinesSudanSurinameSwazilandSwedenSwitzerlandSyrian Arab RepublicTajikistanTanzaniaThailandTimor-LesteTogoTongaTrinidad and TobagoTunisiaTurkeyTurkmenistanUgandaUkraineUnited KingdomUnited StatesUruguayUzbekistanVanuatuVenezuela, RBVietnamVirgin Islands (U.S.)Yemen, Rep.ZambiaZimbabwe línea de tiempo (timeline):
En esta escala de tiempo se presenta un gráfico de 1971 y 2015 de Germany. Los datos de 1970 están ausentes. El número de observaciones reales por fecha: 45.
Fuente (nombre):
Indicadores del desarrollo mundial
Fuente (organización):
World Bank staff estimates using data from the United Nations Statistics Division's Statistical Yearbook, and the UNESCO Institute for Statistics online database.
Categorías:
Economy & Growth, Environment
Se ha actualizado:
23 abr 2017 año
Los indicadores de los cambios de valor en los últimos años
Mínimo:
8.909 bn
1 ene 1971 año
Máximo:
184.788 bn
1 ene 2015 año
A la fecha de observación
Valor
Cambio absoluto
El cambio con respecto al valor anterior
1 ene 1971 año
8.909 bn
+8.909 bn
0.0%
1 ene 1972 año
10.304 bn
+1.395 bn
15.66%
1 ene 1973 año
12.346 bn
+2.042 bn
19.82%
1 ene 1974 año
16.403 bn
+4.057 bn
32.86%
1 ene 1975 año
18.336 bn
+1.932 bn
11.78%
1 ene 1976 año
20.231 bn
+1.895 bn
10.33%
1 ene 1977 año
21.449 bn
+1.218 bn
6.02%
1 ene 1978 año
24.742 bn
+3.293 bn
15.35%
1 ene 1979 año
30.618 bn
+5.876 bn
23.75%
1 ene 1980 año
36.335 bn
+5.717 bn
18.67%
1 ene 1981 año
39.184 bn
+2.849 bn
7.84%
1 ene 1982 año
32.95 bn
-6.234 bn
-15.91%
1 ene 1983 año
31.938 bn
-1.012 bn
-3.07%
1 ene 1984 año
31.795 bn
-143.172 millones
-0.45%
1 ene 1985 año
30.032 bn
-1.763 bn
-5.54%
1 ene 1986 año
30.342 bn
+309.673 millones
1.03%
1 ene 1987 año
43.23 bn
+12.889 bn
42.48%
1 ene 1988 año
53.562 bn
+10.331 bn
23.9%
1 ene 1989 año
58.102 bn
+4.54 bn
8.48%
1 ene 1990 año
58.079 bn
-22.14 millones
-0.04%
1 ene 1991 año
73.546 bn
+15.467 bn
26.63%
1 ene 1992 año
77.035 bn
+3.489 bn
4.74%
1 ene 1993 año
87.8 bn
+10.765 bn
13.97%
1 ene 1994 año
85.211 bn
-2.589 bn
-2.95%
1 ene 1995 año
90.534 bn
+5.323 bn
6.25%
1 ene 1996 año
108.633 bn
+18.099 bn
19.99%
1 ene 1997 año
105.057 bn
-3.576 bn
-3.29%
1 ene 1998 año
95.19 bn
-9.867 bn
-9.39%
1 ene 1999 año
91.044 bn
-4.146 bn
-4.36%
1 ene 2000 año
89.221 bn
-1.823 bn
-2.0%
1 ene 2001 año
79.308 bn
-9.913 bn
-11.11%
1 ene 2002 año
79.277 bn
-31.19 millones
-0.04%
1 ene 2003 año
84.282 bn
+5.006 bn
6.31%
1 ene 2004 año
101.985 bn
+17.703 bn
21.0%
1 ene 2005 año
116.727 bn
+14.742 bn
14.45%
1 ene 2006 año
118.814 bn
+2.087 bn
1.79%
1 ene 2007 año
125.832 bn
+7.018 bn
5.91%
1 ene 2008 año
146.254 bn
+20.422 bn
16.23%
1 ene 2009 año
161.013 bn
+14.759 bn
10.09%
1 ene 2010 año
162.508 bn
+1.495 bn
0.93%
1 ene 2011 año
163.081 bn
+572.484 millones
0.35%
1 ene 2012 año
174.894 bn
+11.813 bn
7.24%
1 ene 2013 año
169.233 bn
-5.66 bn
-3.24%
1 ene 2014 año
178.702 bn
+9.468 bn
5.59%
1 ene 2015 año
184.788 bn
+6.086 bn
3.41%
Ranking de los países por los datos estadísticos actuales


Comentarios: