29
/es/
es
AIzaSyAYiBZKx7MnpbEhh9jyipgxe19OcubqV5w
April 1, 2024
138964
Germany
DEU
true
2
1
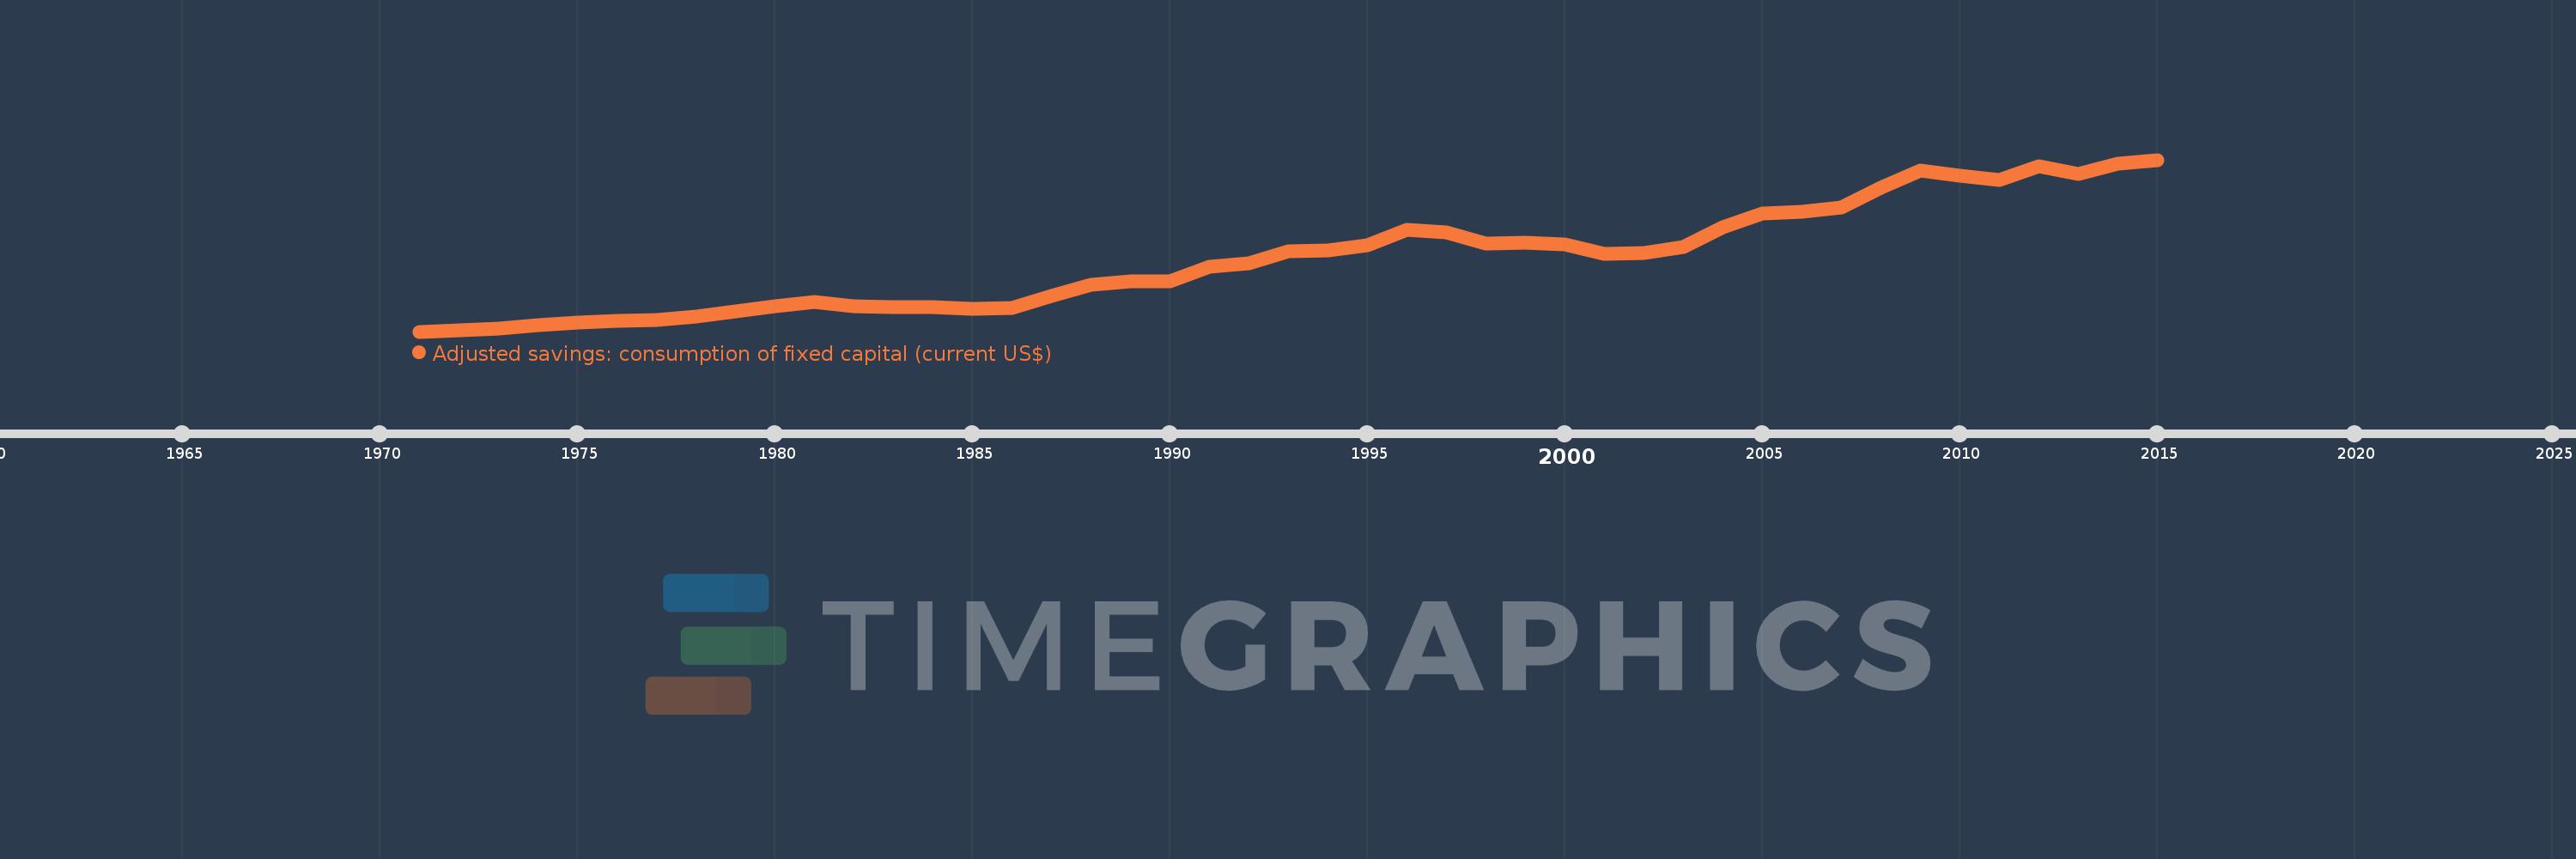
Adjusted savings: consumption of fixed capital (current US$)
2015,2014,2013,2012,2011,2010,2009,2008,2007,2006,2005,2004,2003,2002,2001,2000,1999,1998,1997,1996,1995,1994,1993,1992,1991,1990,1989,1988,1987,1986,1985,1984,1983,1982,1981,1980,1979,1978,1977,1976,1975,1974,1973,1972,1971
Estas estadísticas en otros países:
AfghanistanAlbaniaAlgeriaAndorraAngolaAntigua and BarbudaArgentinaArmeniaArubaAustraliaAustriaAzerbaijanBahamas, TheBahrainBangladeshBarbadosBelarusBelgiumBelizeBeninBermudaBhutanBoliviaBosnia and HerzegovinaBotswanaBrazilBrunei DarussalamBulgariaBurkina FasoBurundiCabo VerdeCambodiaCameroonCanadaCayman IslandsCentral African RepublicChadChannel IslandsChileChinaColombiaComorosCongo, Dem. Rep.Congo, Rep.Costa RicaCote d'IvoireCroatiaCubaCyprusCzech RepublicDenmarkDjiboutiDominicaDominican RepublicEcuadorEgypt, Arab Rep.El SalvadorEquatorial GuineaEritreaEstoniaEthiopiaFaroe IslandsFijiFinlandFranceFrench PolynesiaGabonGambia, TheGeorgiaGermanyGhanaGreeceGreenlandGrenadaGuatemalaGuineaGuinea-BissauGuyanaHaitiHondurasHong Kong SAR, ChinaHungaryIcelandIndiaIndonesiaIran, Islamic Rep.IraqIrelandIsle of ManIsraelItalyJamaicaJapanJordanKazakhstanKenyaKiribatiKorea, Rep.KosovoKuwaitKyrgyz RepublicLao PDRLatviaLebanonLesothoLiberiaLibyaLiechtensteinLithuaniaLuxembourgMacao SAR, ChinaMacedonia, FYRMadagascarMalawiMalaysiaMaldivesMaliMaltaMarshall IslandsMauritaniaMauritiusMexicoMicronesia, Fed. Sts.MoldovaMonacoMongoliaMontenegroMoroccoMozambiqueMyanmarNamibiaNepalNetherlandsNew CaledoniaNew ZealandNicaraguaNigerNigeriaNorwayOmanPakistanPalauPanamaPapua New GuineaParaguayPeruPhilippinesPolandPortugalPuerto RicoQatarRomaniaRussian FederationRwandaSamoaSan MarinoSao Tome and PrincipeSaudi ArabiaSenegalSerbiaSeychellesSierra LeoneSingaporeSlovak RepublicSloveniaSolomon IslandsSomaliaSouth AfricaSouth SudanSpainSri LankaSt. Kitts and NevisSt. LuciaSt. Vincent and the GrenadinesSudanSurinameSwazilandSwedenSwitzerlandSyrian Arab RepublicTajikistanTanzaniaThailandTimor-LesteTogoTongaTrinidad and TobagoTunisiaTurkeyTurkmenistanTuvaluUgandaUkraineUnited Arab EmiratesUnited KingdomUnited StatesUruguayUzbekistanVanuatuVenezuela, RBVietnamVirgin Islands (U.S.)West Bank and GazaYemen, Rep.ZambiaZimbabwe línea de tiempo (timeline):
En esta escala de tiempo se presenta un gráfico de 1971 y 2015 de Germany. Los datos de 1970 están ausentes. El número de observaciones reales por fecha: 45.
Fuente (nombre):
Indicadores del desarrollo mundial
Fuente (organización):
World Bank staff estimates using data from the United Nations Statistics Division's National Accounts Statistics.
Categorías:
Economy & Growth, Environment
Se ha actualizado:
23 abr 2017 año
Los indicadores de los cambios de valor en los últimos años
Mínimo:
27.28 bn
1 ene 1971 año
Máximo:
686.918 bn
1 ene 2015 año
A la fecha de observación
Valor
Cambio absoluto
El cambio con respecto al valor anterior
1 ene 1971 año
27.28 bn
+27.28 bn
0.0%
1 ene 1972 año
32.527 bn
+5.247 bn
19.23%
1 ene 1973 año
39.55 bn
+7.023 bn
21.59%
1 ene 1974 año
52.265 bn
+12.715 bn
32.15%
1 ene 1975 año
60.826 bn
+8.561 bn
16.38%
1 ene 1976 año
69.517 bn
+8.691 bn
14.29%
1 ene 1977 año
72.573 bn
+3.055 bn
4.4%
1 ene 1978 año
83.859 bn
+11.286 bn
15.55%
1 ene 1979 año
104.737 bn
+20.879 bn
24.9%
1 ene 1980 año
125.823 bn
+21.086 bn
20.13%
1 ene 1981 año
141.153 bn
+15.33 bn
12.18%
1 ene 1982 año
123.444 bn
-17.709 bn
-12.55%
1 ene 1983 año
122.715 bn
-729.249 millones
-0.59%
1 ene 1984 año
122.51 bn
-204.444 millones
-0.17%
1 ene 1985 año
116.036 bn
-6.474 bn
-5.28%
1 ene 1986 año
116.987 bn
+950.389 millones
0.82%
1 ene 1987 año
164.983 bn
+47.997 bn
41.03%
1 ene 1988 año
206.715 bn
+41.732 bn
25.29%
1 ene 1989 año
221.353 bn
+14.638 bn
7.08%
1 ene 1990 año
219.663 bn
-1.69 bn
-0.76%
1 ene 1991 año
276.705 bn
+57.043 bn
25.97%
1 ene 1992 año
290.536 bn
+13.83 bn
5.0%
1 ene 1993 año
335.774 bn
+45.238 bn
15.57%
1 ene 1994 año
337.468 bn
+1.694 bn
0.5%
1 ene 1995 año
357.707 bn
+20.239 bn
6.0%
1 ene 1996 año
419.567 bn
+61.861 bn
17.29%
1 ene 1997 año
409.525 bn
-10.042 bn
-2.39%
1 ene 1998 año
364.603 bn
-44.922 bn
-10.97%
1 ene 1999 año
368.078 bn
+3.475 bn
0.95%
1 ene 2000 año
361.839 bn
-6.239 bn
-1.69%
1 ene 2001 año
326.473 bn
-35.367 bn
-9.77%
1 ene 2002 año
327.77 bn
+1.298 bn
0.4%
1 ene 2003 año
352.505 bn
+24.735 bn
7.55%
1 ene 2004 año
427.432 bn
+74.927 bn
21.26%
1 ene 2005 año
479.138 bn
+51.706 bn
12.1%
1 ene 2006 año
488.504 bn
+9.366 bn
1.95%
1 ene 2007 año
505.351 bn
+16.847 bn
3.45%
1 ene 2008 año
579.019 bn
+73.668 bn
14.58%
1 ene 2009 año
644.946 bn
+65.926 bn
11.39%
1 ene 2010 año
626.278 bn
-18.668 bn
-2.89%
1 ene 2011 año
608.908 bn
-17.37 bn
-2.77%
1 ene 2012 año
661.021 bn
+52.113 bn
8.56%
1 ene 2013 año
632.411 bn
-28.61 bn
-4.33%
1 ene 2014 año
670.616 bn
+38.204 bn
6.04%
1 ene 2015 año
686.918 bn
+16.302 bn
2.43%
Ranking de los países por los datos estadísticos actuales


Comentarios: