29
/es/
es
AIzaSyAYiBZKx7MnpbEhh9jyipgxe19OcubqV5w
April 1, 2024
135547
Gabon
GAB
true
2
1
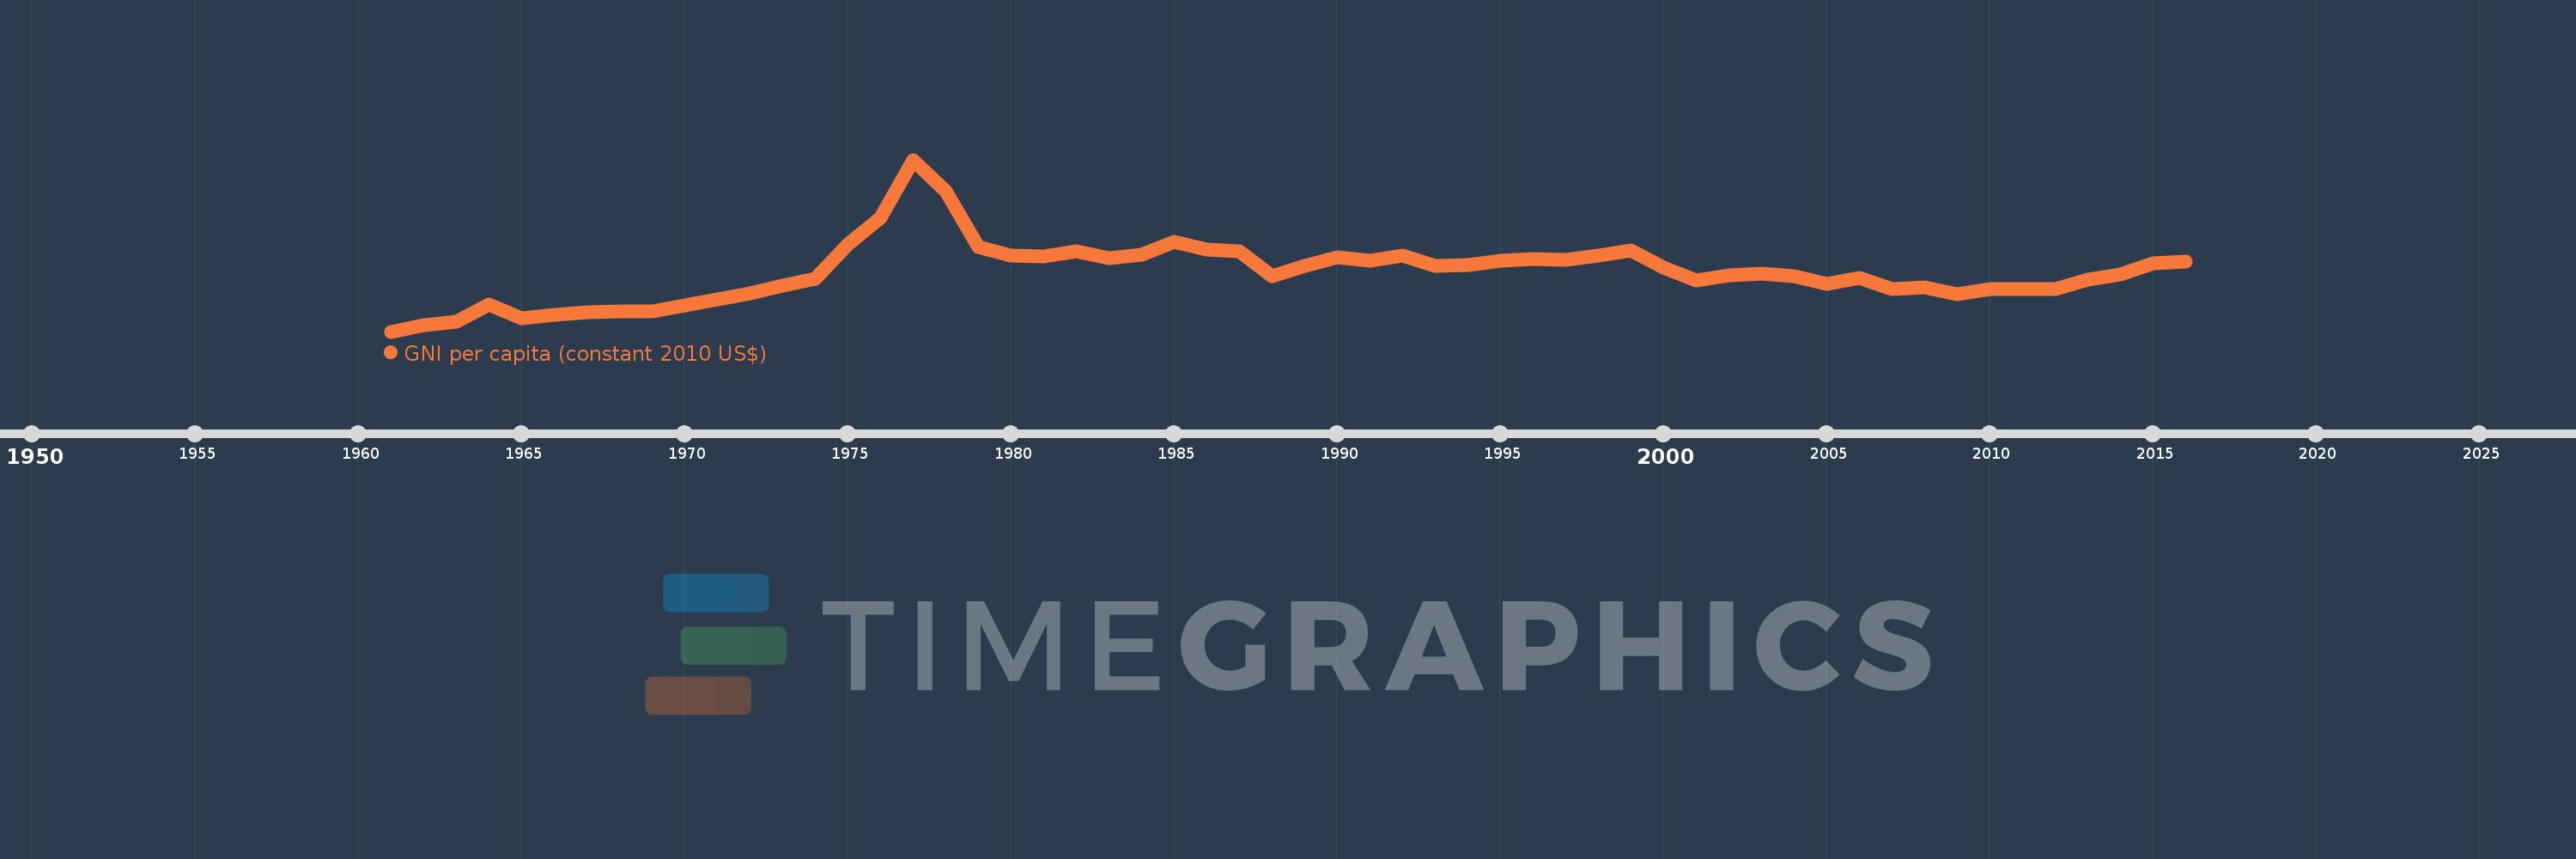
GNI per capita (constant 2010 US$)
2016,2015,2014,2013,2012,2011,2010,2009,2008,2007,2006,2005,2004,2003,2002,2001,2000,1999,1998,1997,1996,1995,1994,1993,1992,1991,1990,1989,1988,1987,1986,1985,1984,1983,1982,1981,1980,1979,1978,1977,1976,1975,1974,1973,1972,1971,1970,1969,1968,1967,1966,1965,1964,1963,1962,1961
Estas estadísticas en otros países:
AfghanistanAlbaniaAlgeriaAndorraAngolaAntigua and BarbudaArab WorldArgentinaArmeniaAustraliaAustriaAzerbaijanBahamas, TheBahrainBangladeshBarbadosBelarusBelgiumBelizeBeninBermudaBhutanBoliviaBosnia and HerzegovinaBotswanaBrazilBrunei DarussalamBulgariaBurkina FasoBurundiCabo VerdeCambodiaCameroonCanadaCaribbean small statesCentral African RepublicCentral Europe and the BalticsChadChileChinaColombiaComorosCongo, Dem. Rep.Congo, Rep.Costa RicaCote d'IvoireCroatiaCubaCyprusCzech RepublicDenmarkDominicaDominican RepublicEarly-demographic dividendEast Asia & PacificEast Asia & Pacific (excluding high income)East Asia & Pacific (IDA & IBRD countries)EcuadorEgypt, Arab Rep.El SalvadorEquatorial GuineaEritreaEstoniaEthiopiaEuro areaEurope & Central AsiaEurope & Central Asia (excluding high income)Europe & Central Asia (IDA & IBRD countries)European UnionFaroe IslandsFijiFinlandFragile and conflict affected situationsFranceGabonGambia, TheGeorgiaGermanyGhanaGreeceGrenadaGuatemalaGuineaGuinea-BissauGuyanaHaitiHeavily indebted poor countries (HIPC)High incomeHondurasHong Kong SAR, ChinaHungaryIBRD onlyIcelandIDA & IBRD totalIDA blendIDA onlyIDA totalIndiaIndonesiaIran, Islamic Rep.IraqIrelandIsle of ManIsraelItalyJamaicaJapanJordanKazakhstanKenyaKiribatiKorea, Rep.KosovoKuwaitKyrgyz RepublicLao PDRLate-demographic dividendLatin America & Caribbean Latin America & Caribbean (excluding high income)Latin America & the Caribbean (IDA & IBRD countries)LatviaLeast developed countries: UN classificationLebanonLesothoLiberiaLibyaLiechtensteinLithuaniaLow & middle incomeLow incomeLower middle incomeLuxembourgMacao SAR, ChinaMacedonia, FYRMadagascarMalawiMalaysiaMaldivesMaliMaltaMarshall IslandsMauritaniaMauritiusMexicoMicronesia, Fed. Sts.Middle East & North AfricaMiddle East & North Africa (excluding high income)Middle East & North Africa (IDA & IBRD countries)Middle incomeMoldovaMongoliaMontenegroMoroccoMozambiqueMyanmarNamibiaNauruNepalNetherlandsNew ZealandNicaraguaNigerNigeriaNorth AmericaNorwayOECD membersOmanOther small statesPacific island small statesPakistanPalauPanamaPapua New GuineaParaguayPeruPhilippinesPolandPortugalPost-demographic dividendPre-demographic dividendPuerto RicoQatarRomaniaRussian FederationRwandaSamoaSao Tome and PrincipeSaudi ArabiaSenegalSerbiaSeychellesSierra LeoneSingaporeSlovak RepublicSloveniaSmall statesSolomon IslandsSouth AfricaSouth AsiaSouth Asia (IDA & IBRD)South SudanSpainSri LankaSt. Kitts and NevisSt. LuciaSt. Vincent and the GrenadinesSub-Saharan Africa Sub-Saharan Africa (excluding high income)Sub-Saharan Africa (IDA & IBRD countries)SudanSurinameSwazilandSwedenSwitzerlandTajikistanTanzaniaThailandTimor-LesteTogoTongaTrinidad and TobagoTunisiaTurkeyTurkmenistanTuvaluUgandaUkraineUnited Arab EmiratesUnited KingdomUnited StatesUpper middle incomeUruguayUzbekistanVanuatuVenezuela, RBVietnamWest Bank and GazaWorldYemen, Rep.ZambiaZimbabwe línea de tiempo (timeline):
En esta escala de tiempo se presenta un gráfico de 1961 y 2016 de Gabon. Los datos de 1960 están ausentes. El número de observaciones reales por fecha: 56.
Fuente (nombre):
Indicadores del desarrollo mundial
Fuente (organización):
World Bank national accounts data, and OECD National Accounts data files.
Categorías:
Economy & Growth
Se ha actualizado:
23 abr 2017 año
Los indicadores de los cambios de valor en los últimos años
Mínimo:
4.423 mil
1 ene 1961 año
Máximo:
19.359 mil
1 ene 1977 año
A la fecha de observación
Valor
Cambio absoluto
El cambio con respecto al valor anterior
1 ene 1961 año
4.423 mil
+4.423 mil
0.0%
1 ene 1962 año
5.006 mil
+583.199
13.19%
1 ene 1963 año
5.26 mil
+254.095
5.08%
1 ene 1964 año
6.788 mil
+1.528 mil
29.05%
1 ene 1965 año
5.551 mil
-1.237 mil
-18.22%
1 ene 1966 año
5.898 mil
+346.23
6.24%
1 ene 1967 año
6.098 mil
+200.514
3.4%
1 ene 1968 año
6.178 mil
+79.957
1.31%
1 ene 1969 año
6.191 mil
+13.432
0.22%
1 ene 1970 año
6.699 mil
+507.597
8.2%
1 ene 1971 año
7.227 mil
+527.53
7.87%
1 ene 1972 año
7.712 mil
+484.995
6.71%
1 ene 1973 año
8.45 mil
+738.085
9.57%
1 ene 1974 año
9.017 mil
+567.607
6.72%
1 ene 1975 año
11.992 mil
+2.975 mil
32.99%
1 ene 1976 año
14.354 mil
+2.362 mil
19.7%
1 ene 1977 año
19.359 mil
+5.004 mil
34.86%
1 ene 1978 año
16.626 mil
-2.732 mil
-14.11%
1 ene 1979 año
11.752 mil
-4.874 mil
-29.32%
1 ene 1980 año
11.005 mil
-746.837
-6.35%
1 ene 1981 año
10.987 mil
-17.937
-0.16%
1 ene 1982 año
11.407 mil
+419.932
3.82%
1 ene 1983 año
10.829 mil
-578.632
-5.07%
1 ene 1984 año
11.139 mil
+309.743
2.86%
1 ene 1985 año
12.229 mil
+1.09 mil
9.79%
1 ene 1986 año
11.585 mil
-644.064
-5.27%
1 ene 1987 año
11.402 mil
-183.144
-1.58%
1 ene 1988 año
9.217 mil
-2.184 mil
-19.16%
1 ene 1989 año
10.117 mil
+899.301
9.76%
1 ene 1990 año
10.89 mil
+772.965
7.64%
1 ene 1991 año
10.616 mil
-273.504
-2.51%
1 ene 1992 año
11.012 mil
+395.317
3.72%
1 ene 1993 año
10.158 mil
-853.098
-7.75%
1 ene 1994 año
10.198 mil
+39.184
0.39%
1 ene 1995 año
10.569 mil
+371.691
3.64%
1 ene 1996 año
10.702 mil
+133.069
1.26%
1 ene 1997 año
10.689 mil
-13.89
-0.13%
1 ene 1998 año
11.028 mil
+339.776
3.18%
1 ene 1999 año
11.45 mil
+421.36
3.82%
1 ene 2000 año
9.96 mil
-1.489 mil
-13.01%
1 ene 2001 año
8.871 mil
-1.089 mil
-10.94%
1 ene 2002 año
9.346 mil
+475.098
5.36%
1 ene 2003 año
9.46 mil
+113.282
1.21%
1 ene 2004 año
9.26 mil
-199.268
-2.11%
1 ene 2005 año
8.552 mil
-707.879
-7.64%
1 ene 2006 año
9.094 mil
+541.123
6.33%
1 ene 2007 año
8.143 mil
-950.887
-10.46%
1 ene 2008 año
8.272 mil
+129.591
1.59%
1 ene 2009 año
7.677 mil
-595.323
-7.2%
1 ene 2010 año
8.13 mil
+453.127
5.9%
1 ene 2011 año
8.089 mil
-41.334
-0.51%
1 ene 2012 año
8.116 mil
+27.265
0.34%
1 ene 2013 año
8.951 mil
+834.605
10.28%
1 ene 2014 año
9.399 mil
+448.854
5.01%
1 ene 2015 año
10.38 mil
+980.829
10.43%
1 ene 2016 año
10.486 mil
+105.485
1.02%
Ranking de los países por los datos estadísticos actuales


Comentarios: