29
/es/
es
AIzaSyAYiBZKx7MnpbEhh9jyipgxe19OcubqV5w
April 1, 2024
134175
France
FRA
true
2
1
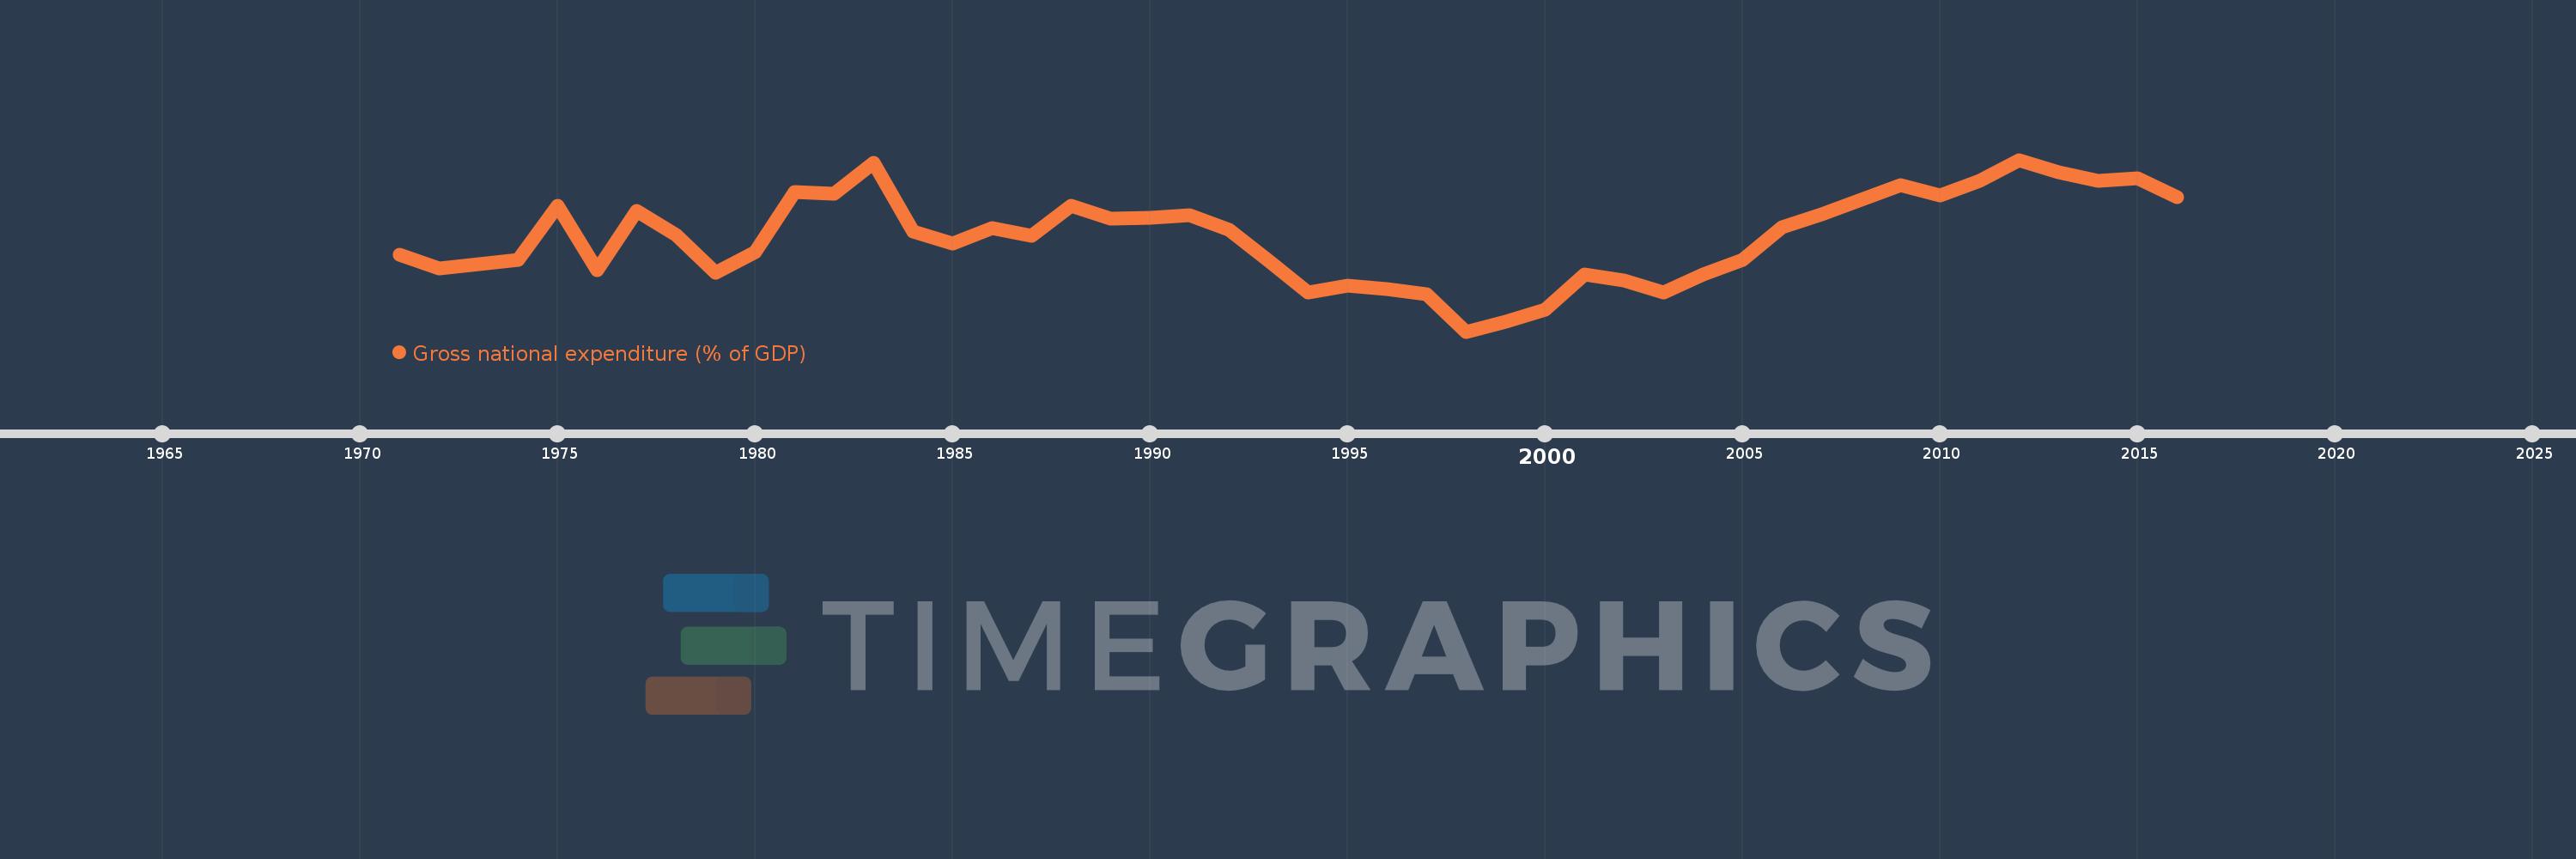
Gross national expenditure (% of GDP)
2016,2015,2014,2013,2012,2011,2010,2009,2008,2007,2006,2005,2004,2003,2002,2001,2000,1999,1998,1997,1996,1995,1994,1993,1992,1991,1990,1989,1988,1987,1986,1985,1984,1983,1982,1981,1980,1979,1978,1977,1976,1975,1974,1973,1972,1971
Estas estadísticas en otros países:
AfghanistanAlbaniaAlgeriaAngolaAntigua and BarbudaArgentinaArmeniaArubaAustraliaAustriaAzerbaijanBahamas, TheBahrainBangladeshBarbadosBelarusBelgiumBelizeBeninBermudaBhutanBoliviaBosnia and HerzegovinaBotswanaBrazilBrunei DarussalamBulgariaBurkina FasoBurundiCabo VerdeCambodiaCameroonCanadaCentral African RepublicChadChileChinaColombiaComorosCongo, Dem. Rep.Congo, Rep.Costa RicaCote d'IvoireCroatiaCubaCyprusCzech RepublicDenmarkDjiboutiDominicaDominican RepublicEcuadorEgypt, Arab Rep.El SalvadorEquatorial GuineaEritreaEstoniaEthiopiaFaroe IslandsFijiFinlandFranceGabonGambia, TheGeorgiaGermanyGhanaGreeceGrenadaGuatemalaGuineaGuinea-BissauGuyanaHaitiHondurasHong Kong SAR, ChinaHungaryIcelandIndiaIndonesiaIran, Islamic Rep.IraqIrelandIsraelItalyJamaicaJapanJordanKazakhstanKenyaKiribatiKorea, Rep.KosovoKuwaitKyrgyz RepublicLao PDRLatviaLebanonLesothoLiberiaLibyaLithuaniaLuxembourgMacao SAR, ChinaMacedonia, FYRMadagascarMalawiMalaysiaMaldivesMaliMaltaMauritaniaMauritiusMexicoMicronesia, Fed. Sts.MoldovaMongoliaMontenegroMoroccoMozambiqueNamibiaNepalNetherlandsNew CaledoniaNew ZealandNicaraguaNigerNigeriaNorwayOmanPakistanPanamaPapua New GuineaParaguayPeruPhilippinesPolandPortugalPuerto RicoQatarRomaniaRussian FederationRwandaSaudi ArabiaSenegalSerbiaSeychellesSierra LeoneSingaporeSlovak RepublicSloveniaSolomon IslandsSomaliaSouth AfricaSouth SudanSpainSri LankaSt. Kitts and NevisSt. LuciaSt. Vincent and the GrenadinesSudanSurinameSwazilandSwedenSwitzerlandSyrian Arab RepublicTajikistanTanzaniaThailandTimor-LesteTogoTongaTrinidad and TobagoTunisiaTurkeyTurkmenistanUgandaUkraineUnited Arab EmiratesUnited KingdomUnited StatesUruguayUzbekistanVanuatuVenezuela, RBVietnamWest Bank and GazaYemen, Rep.ZambiaZimbabwe línea de tiempo (timeline):
En esta escala de tiempo se presenta un gráfico de 1971 y 2016 de France. Los datos de 1970 están ausentes. El número de observaciones reales por fecha: 46.
Fuente (nombre):
Indicadores del desarrollo mundial
Fuente (organización):
World Bank national accounts data, and OECD National Accounts data files.
Categorías:
Economy & Growth
Se ha actualizado:
23 abr 2017 año
Los indicadores de los cambios de valor en los últimos años
Mínimo:
97.096
1 ene 1998 año
Máximo:
102.562
1 ene 2012 año
A la fecha de observación
Valor
Cambio absoluto
El cambio con respecto al valor anterior
1 ene 1971 año
99.536
+99.536
0.0%
1 ene 1972 año
99.102
-0.434
-0.44%
1 ene 1973 año
99.251
+0.148
0.15%
1 ene 1974 año
99.374
+0.123
0.12%
1 ene 1975 año
101.108
+1.734
1.74%
1 ene 1976 año
99.042
-2.065
-2.04%
1 ene 1977 año
100.942
+1.9
1.92%
1 ene 1978 año
100.184
-0.758
-0.75%
1 ene 1979 año
98.979
-1.205
-1.2%
1 ene 1980 año
99.622
+0.644
0.65%
1 ene 1981 año
101.548
+1.926
1.93%
1 ene 1982 año
101.488
-0.06
-0.06%
1 ene 1983 año
102.462
+0.974
0.96%
1 ene 1984 año
100.285
-2.177
-2.12%
1 ene 1985 año
99.89
-0.395
-0.39%
1 ene 1986 año
100.394
+0.504
0.5%
1 ene 1987 año
100.141
-0.252
-0.25%
1 ene 1988 año
101.11
+0.969
0.97%
1 ene 1989 año
100.684
-0.427
-0.42%
1 ene 1990 año
100.709
+0.026
0.03%
1 ene 1991 año
100.801
+0.092
0.09%
1 ene 1992 año
100.33
-0.471
-0.47%
1 ene 1993 año
99.359
-0.971
-0.97%
1 ene 1994 año
98.351
-1.008
-1.01%
1 ene 1995 año
98.551
+0.2
0.2%
1 ene 1996 año
98.46
-0.091
-0.09%
1 ene 1997 año
98.292
-0.169
-0.17%
1 ene 1998 año
97.096
-1.196
-1.22%
1 ene 1999 año
97.414
+0.318
0.33%
1 ene 2000 año
97.793
+0.379
0.39%
1 ene 2001 año
98.912
+1.119
1.14%
1 ene 2002 año
98.728
-0.184
-0.19%
1 ene 2003 año
98.336
-0.392
-0.4%
1 ene 2004 año
98.91
+0.574
0.58%
1 ene 2005 año
99.379
+0.469
0.47%
1 ene 2006 año
100.414
+1.036
1.04%
1 ene 2007 año
100.836
+0.421
0.42%
1 ene 2008 año
101.291
+0.455
0.45%
1 ene 2009 año
101.751
+0.46
0.45%
1 ene 2010 año
101.425
-0.327
-0.32%
1 ene 2011 año
101.882
+0.457
0.45%
1 ene 2012 año
102.562
+0.68
0.67%
1 ene 2013 año
102.157
-0.405
-0.4%
1 ene 2014 año
101.883
-0.274
-0.27%
1 ene 2015 año
101.987
+0.104
0.1%
1 ene 2016 año
101.377
-0.61
-0.6%
Ranking de los países por los datos estadísticos actuales


Comentarios: