29
/es/
es
AIzaSyAYiBZKx7MnpbEhh9jyipgxe19OcubqV5w
April 1, 2024
133960
France
FRA
true
2
1
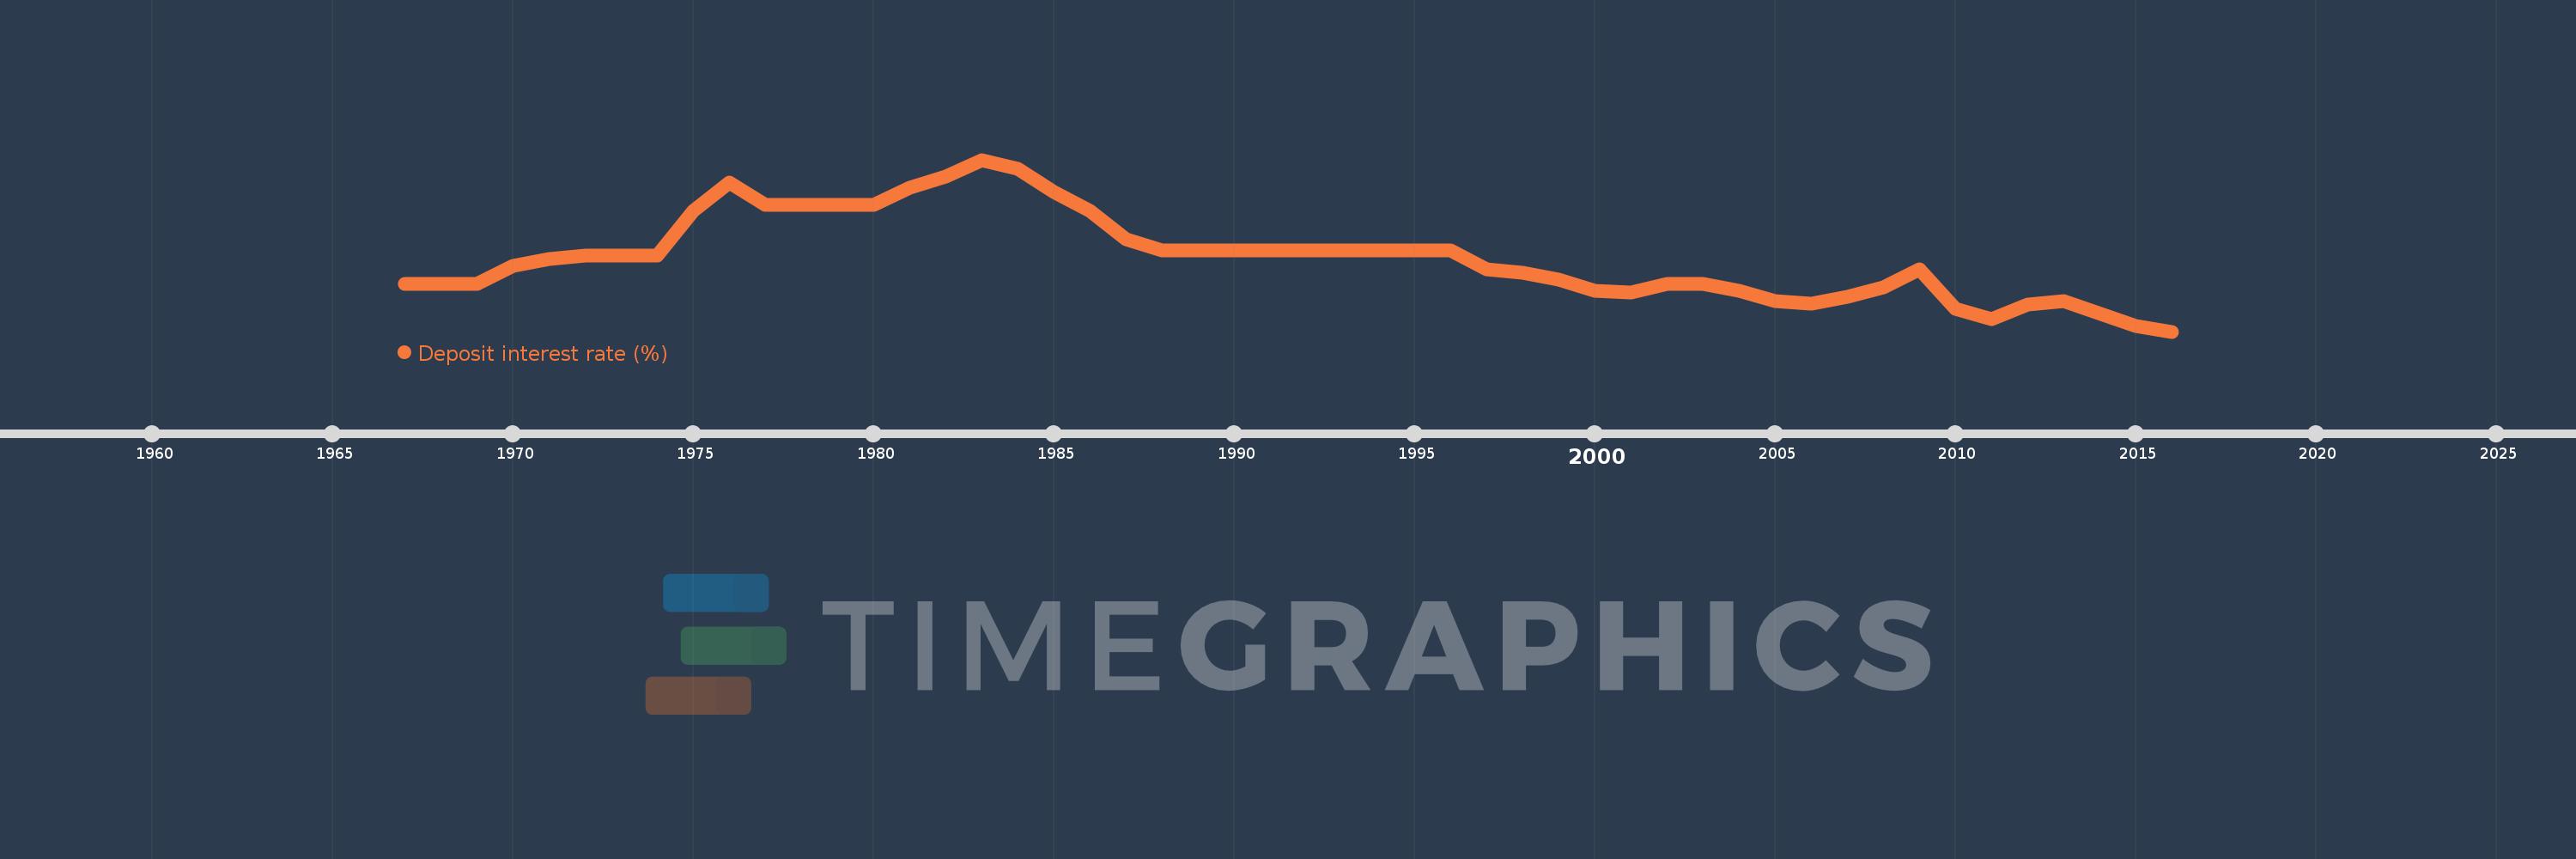
Deposit interest rate (%)
2016,2015,2013,2012,2011,2010,2009,2008,2007,2006,2005,2004,2003,2002,2001,2000,1999,1998,1997,1996,1995,1994,1993,1992,1991,1990,1989,1988,1987,1986,1985,1984,1983,1982,1981,1980,1979,1978,1977,1976,1975,1974,1973,1972,1971,1970,1969,1968,1967
Estas estadísticas en otros países:
AlbaniaAlgeriaAngolaAntigua and BarbudaArgentinaArmeniaArubaAustraliaAustriaAzerbaijanBahamas, TheBahrainBangladeshBarbadosBelarusBelgiumBelizeBeninBhutanBoliviaBosnia and HerzegovinaBotswanaBrazilBrunei DarussalamBulgariaBurkina FasoBurundiCabo VerdeCambodiaCameroonCanadaCentral African RepublicChadChileChinaColombiaComorosCongo, Dem. Rep.Congo, Rep.Costa RicaCote d'IvoireCroatiaCyprusCzech RepublicDenmarkDjiboutiDominicaDominican RepublicEcuadorEgypt, Arab Rep.Equatorial GuineaEstoniaEthiopiaFijiFinlandFranceGabonGambia, TheGeorgiaGermanyGhanaGreeceGrenadaGuatemalaGuineaGuinea-BissauGuyanaHaitiHondurasHong Kong SAR, ChinaHungaryIcelandIndonesiaIran, Islamic Rep.IraqIrelandIsraelItalyJamaicaJapanJordanKenyaKorea, Rep.KosovoKuwaitKyrgyz RepublicLao PDRLatviaLebanonLesothoLiberiaLibyaLithuaniaLuxembourgMacao SAR, ChinaMacedonia, FYRMadagascarMalawiMalaysiaMaldivesMaliMaltaMauritaniaMauritiusMexicoMicronesia, Fed. Sts.MoldovaMongoliaMontenegroMoroccoMozambiqueMyanmarNamibiaNepalNetherlandsNew ZealandNicaraguaNigerNigeriaNorwayOmanPakistanPanamaPapua New GuineaParaguayPeruPhilippinesPolandPortugalQatarRomaniaRussian FederationRwandaSamoaSan MarinoSao Tome and PrincipeSenegalSerbiaSeychellesSierra LeoneSingaporeSlovak RepublicSloveniaSolomon IslandsSouth AfricaSouth SudanSpainSri LankaSt. Kitts and NevisSt. LuciaSt. Vincent and the GrenadinesSurinameSwazilandSwedenSwitzerlandSyrian Arab RepublicTajikistanTanzaniaThailandTimor-LesteTogoTongaTrinidad and TobagoTunisiaTurkeyUgandaUkraineUnited KingdomUruguayVanuatuVenezuela, RBVietnamWest Bank and GazaYemen, Rep.ZambiaZimbabwe línea de tiempo (timeline):
En esta escala de tiempo se presenta un gráfico de 1967 y 2016 de France. Los datos de 1966 están ausentes. El número de observaciones reales por fecha: 49.
Fuente (nombre):
Indicadores del desarrollo mundial
Fuente (organización):
International Monetary Fund, International Financial Statistics and data files.
Categorías:
Financial Sector
Se ha actualizado:
23 abr 2017 año
Los indicadores de los cambios de valor en los últimos años
Mínimo:
0.896
1 ene 2016 año
A la fecha de observación
Valor
Cambio absoluto
El cambio con respecto al valor anterior
1 ene 1967 año
3.0
+3.0
0.0%
1 ene 1968 año
3.0
0.0
0.0%
1 ene 1969 año
3.0
0.0
0.0%
1 ene 1970 año
3.792
+0.792
26.39%
1 ene 1971 año
4.125
+0.333
8.79%
1 ene 1972 año
4.25
+0.125
3.03%
1 ene 1973 año
4.25
0.0
0.0%
1 ene 1974 año
4.25
0.0
0.0%
1 ene 1975 año
6.25
+2.0
47.06%
1 ene 1976 año
7.5
+1.25
20.0%
1 ene 1977 año
6.5
-1.0
-13.33%
1 ene 1978 año
6.5
0.0
0.0%
1 ene 1979 año
6.5
0.0
0.0%
1 ene 1980 año
6.5
0.0
0.0%
1 ene 1981 año
7.25
+0.75
11.54%
1 ene 1982 año
7.75
+0.5
6.9%
1 ene 1983 año
8.5
+0.75
9.68%
1 ene 1984 año
8.083
-0.417
-4.9%
1 ene 1985 año
7.083
-1.0
-12.37%
1 ene 1986 año
6.25
-0.833
-11.76%
1 ene 1987 año
5.0
-1.25
-20.0%
1 ene 1988 año
4.5
-0.5
-10.0%
1 ene 1989 año
4.5
0.0
0.0%
1 ene 1990 año
4.5
0.0
0.0%
1 ene 1991 año
4.5
0.0
0.0%
1 ene 1992 año
4.5
0.0
0.0%
1 ene 1993 año
4.5
0.0
0.0%
1 ene 1994 año
4.5
0.0
0.0%
1 ene 1995 año
4.5
0.0
0.0%
1 ene 1996 año
4.5
0.0
0.0%
1 ene 1997 año
3.667
-0.833
-18.52%
1 ene 1998 año
3.5
-0.167
-4.55%
1 ene 1999 año
3.208
-0.292
-8.33%
1 ene 2000 año
2.688
-0.521
-16.23%
1 ene 2001 año
2.625
-0.063
-2.33%
1 ene 2002 año
3.0
+0.375
14.29%
1 ene 2003 año
3.0
0.0
0.0%
1 ene 2004 año
2.688
-0.313
-10.42%
1 ene 2005 año
2.25
-0.438
-16.28%
1 ene 2006 año
2.146
-0.104
-4.63%
1 ene 2007 año
2.438
+0.292
13.59%
1 ene 2008 año
2.854
+0.417
17.09%
1 ene 2009 año
3.667
+0.813
28.47%
1 ene 2010 año
1.917
-1.75
-47.73%
1 ene 2011 año
1.458
-0.458
-23.91%
1 ene 2012 año
2.083
+0.625
42.86%
1 ene 2013 año
2.25
+0.167
8.0%
1 ene 2015 año
1.146
-1.104
-49.07%
1 ene 2016 año
0.896
-0.25
-21.82%
Ranking de los países por los datos estadísticos actuales


Comentarios: