29
/es/
es
AIzaSyAYiBZKx7MnpbEhh9jyipgxe19OcubqV5w
April 1, 2024
126069
El Salvador
SLV
true
2
1
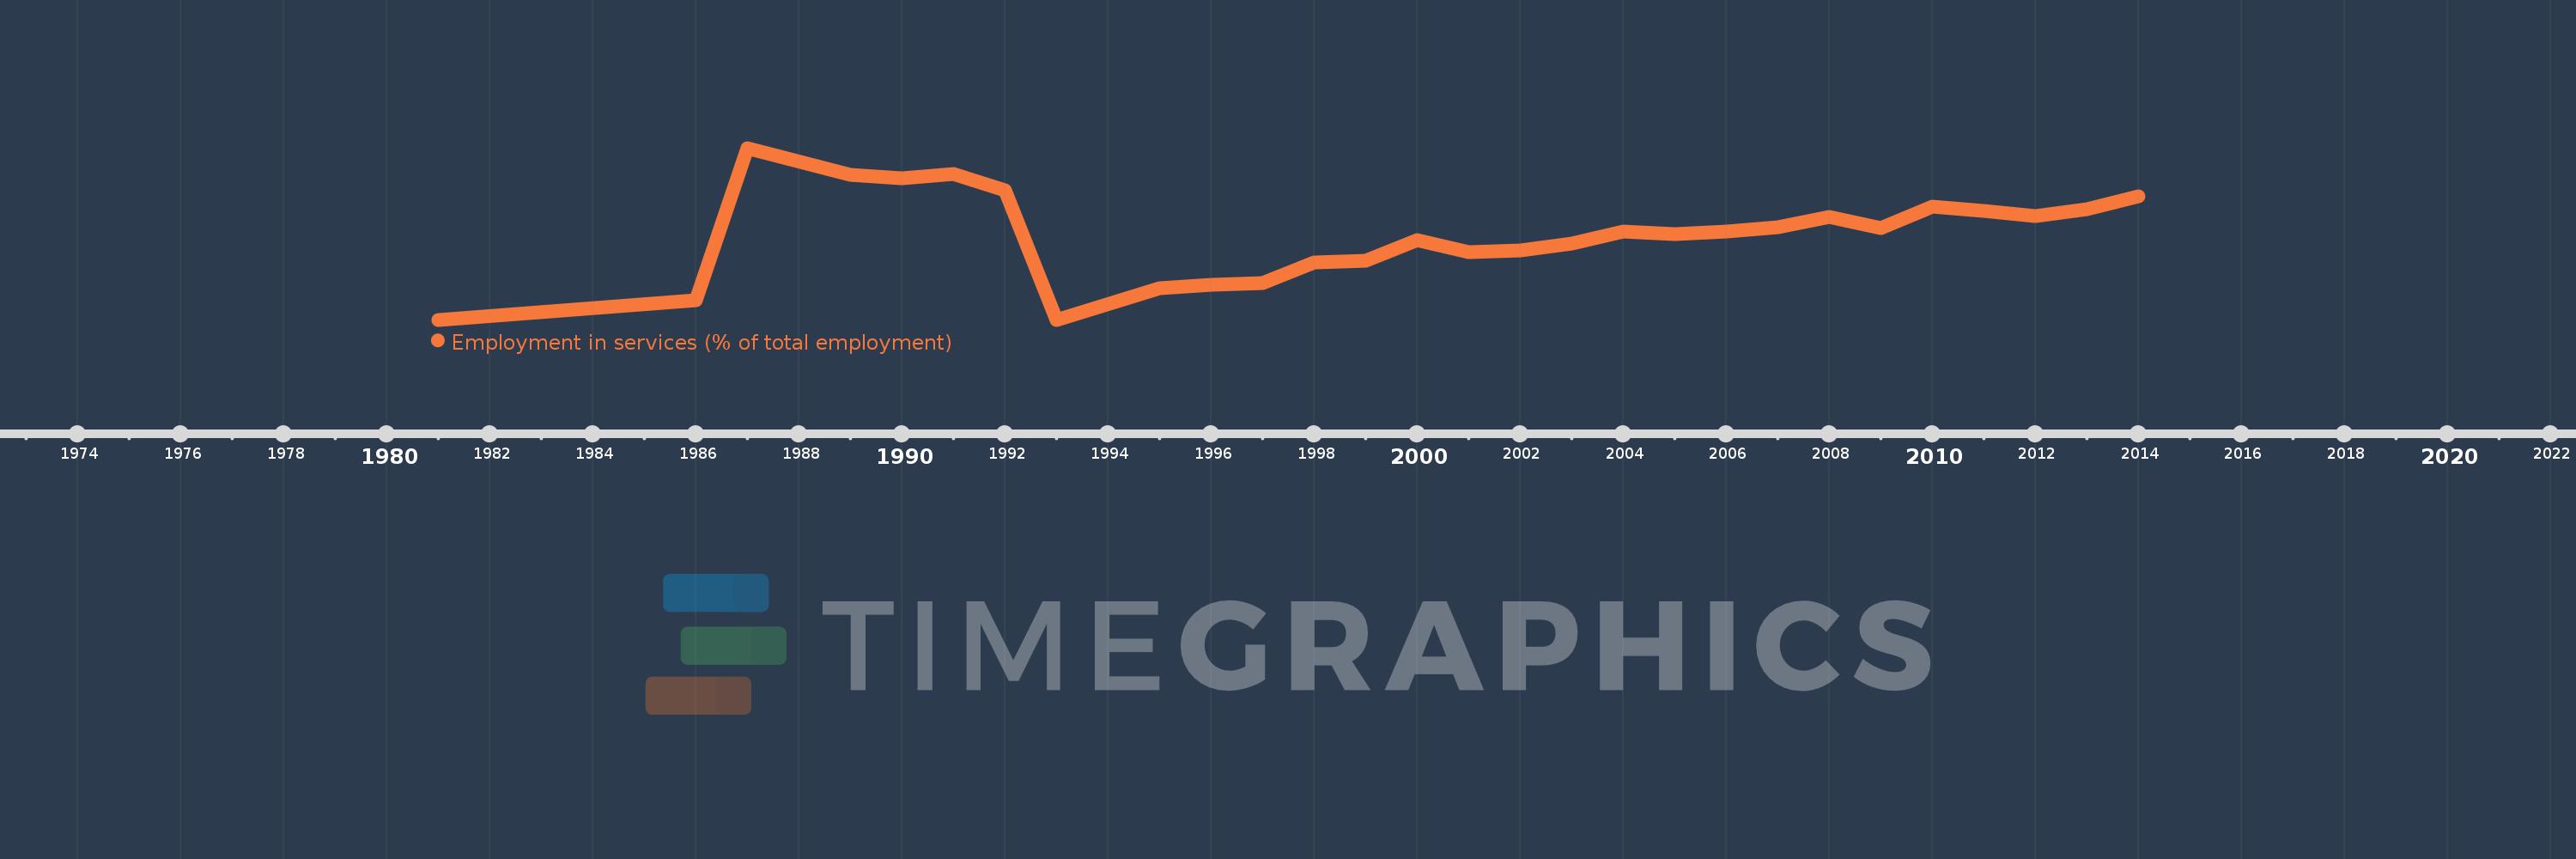
Employment in services (% of total employment)
2014,2013,2012,2011,2010,2009,2008,2007,2006,2005,2004,2003,2002,2001,2000,1999,1998,1997,1996,1995,1993,1992,1991,1990,1989,1987,1986,1981
Estas estadísticas en otros países:
AlbaniaAlgeriaAmerican SamoaAngolaAntigua and BarbudaArab WorldArgentinaArmeniaArubaAustraliaAustriaAzerbaijanBahamas, TheBahrainBangladeshBarbadosBelarusBelgiumBelizeBeninBermudaBhutanBoliviaBotswanaBrazilBritish Virgin IslandsBrunei DarussalamBulgariaBurkina FasoBurundiCambodiaCameroonCanadaCaribbean small statesCayman IslandsCentral Europe and the BalticsChadChileChinaColombiaCongo, Rep.Costa RicaCroatiaCubaCyprusCzech RepublicDenmarkDominicaDominican RepublicEarly-demographic dividendEast Asia & PacificEast Asia & Pacific (excluding high income)East Asia & Pacific (IDA & IBRD countries)EcuadorEgypt, Arab Rep.El SalvadorEquatorial GuineaEstoniaEthiopiaEuro areaEurope & Central AsiaEurope & Central Asia (excluding high income)Europe & Central Asia (IDA & IBRD countries)European UnionFaroe IslandsFijiFinlandFranceFrench PolynesiaGabonGambia, TheGeorgiaGermanyGhanaGreeceGreenlandGrenadaGuamGuatemalaGuineaGuyanaHaitiHigh incomeHondurasHong Kong SAR, ChinaHungaryIBRD onlyIcelandIDA & IBRD totalIDA blendIndiaIndonesiaIran, Islamic Rep.IraqIrelandIsle of ManIsraelItalyJamaicaJapanJordanKazakhstanKenyaKiribatiKorea, Rep.KosovoKuwaitKyrgyz RepublicLao PDRLate-demographic dividendLatin America & Caribbean Latin America & Caribbean (excluding high income)Latin America & the Caribbean (IDA & IBRD countries)LatviaLesothoLiberiaLibyaLithuaniaLow & middle incomeLower middle incomeLuxembourgMacao SAR, ChinaMacedonia, FYRMadagascarMalawiMalaysiaMaldivesMaliMaltaMarshall IslandsMauritiusMexicoMiddle East & North AfricaMiddle East & North Africa (excluding high income)Middle East & North Africa (IDA & IBRD countries)Middle incomeMoldovaMongoliaMontenegroMoroccoMozambiqueMyanmarNamibiaNepalNetherlandsNew CaledoniaNew ZealandNicaraguaNigerNigeriaNorth AmericaNorthern Mariana IslandsNorwayOECD membersOmanPakistanPalauPanamaPapua New GuineaParaguayPeruPhilippinesPolandPortugalPost-demographic dividendPuerto RicoQatarRomaniaRussian FederationRwandaSamoaSan MarinoSao Tome and PrincipeSaudi ArabiaSenegalSerbiaSeychellesSierra LeoneSingaporeSlovak RepublicSloveniaSouth AfricaSouth AsiaSouth Asia (IDA & IBRD)SpainSri LankaSt. Kitts and NevisSt. LuciaSt. Vincent and the GrenadinesSudanSurinameSwedenSwitzerlandSyrian Arab RepublicTajikistanTanzaniaThailandTimor-LesteTogoTongaTrinidad and TobagoTunisiaTurkeyTurks and Caicos IslandsUgandaUkraineUnited Arab EmiratesUnited KingdomUnited StatesUpper middle incomeUruguayUzbekistanVanuatuVenezuela, RBVietnamWest Bank and GazaWorldYemen, Rep.ZambiaZimbabwe línea de tiempo (timeline):
En esta escala de tiempo se presenta un gráfico de 1981 y 2014 de El Salvador. Los datos de 1980 están ausentes. El número de observaciones reales por fecha: 28.
Fuente (nombre):
Indicadores del desarrollo mundial
Fuente (organización):
International Labour Organization, Key Indicators of the Labour Market database.
Categorías:
Social Protection & Labor
Se ha actualizado:
23 abr 2017 año
Los indicadores de los cambios de valor en los últimos años
Mínimo:
41.5
1 ene 1981 año
Máximo:
67.3
1 ene 1987 año
A la fecha de observación
Valor
Cambio absoluto
El cambio con respecto al valor anterior
1 ene 1981 año
41.5
+41.5
0.0%
1 ene 1986 año
44.4
+2.9
6.99%
1 ene 1987 año
67.3
+22.9
51.58%
1 ene 1989 año
63.3
-4.0
-5.94%
1 ene 1990 año
62.8
-0.5
-0.79%
1 ene 1991 año
63.4
+0.6
0.96%
1 ene 1992 año
60.9
-2.5
-3.94%
1 ene 1993 año
41.5
-19.4
-31.86%
1 ene 1995 año
46.2
+4.7
11.33%
1 ene 1996 año
46.7
+0.5
1.08%
1 ene 1997 año
47.0
+0.3
0.64%
1 ene 1998 año
50.1
+3.1
6.6%
1 ene 1999 año
50.4
+0.3
0.6%
1 ene 2000 año
53.4
+3.0
5.95%
1 ene 2001 año
51.6
-1.8
-3.37%
1 ene 2002 año
51.9
+0.3
0.58%
1 ene 2003 año
53.0
+1.1
2.12%
1 ene 2004 año
54.7
+1.7
3.21%
1 ene 2005 año
54.4
-0.3
-0.55%
1 ene 2006 año
54.8
+0.4
0.74%
1 ene 2007 año
55.4
+0.6
1.09%
1 ene 2008 año
57.0
+1.6
2.89%
1 ene 2009 año
55.3
-1.7
-2.98%
1 ene 2010 año
58.5
+3.2
5.79%
1 ene 2011 año
57.8
-0.7
-1.2%
1 ene 2012 año
57.1
-0.7
-1.21%
1 ene 2013 año
58.1
+1.0
1.75%
1 ene 2014 año
60.1
+2.0
3.44%
Ranking de los países por los datos estadísticos actuales


Comentarios: