29
/es/
es
AIzaSyAYiBZKx7MnpbEhh9jyipgxe19OcubqV5w
April 1, 2024
124738
Egypt, Arab Rep.
EGY
true
2
1
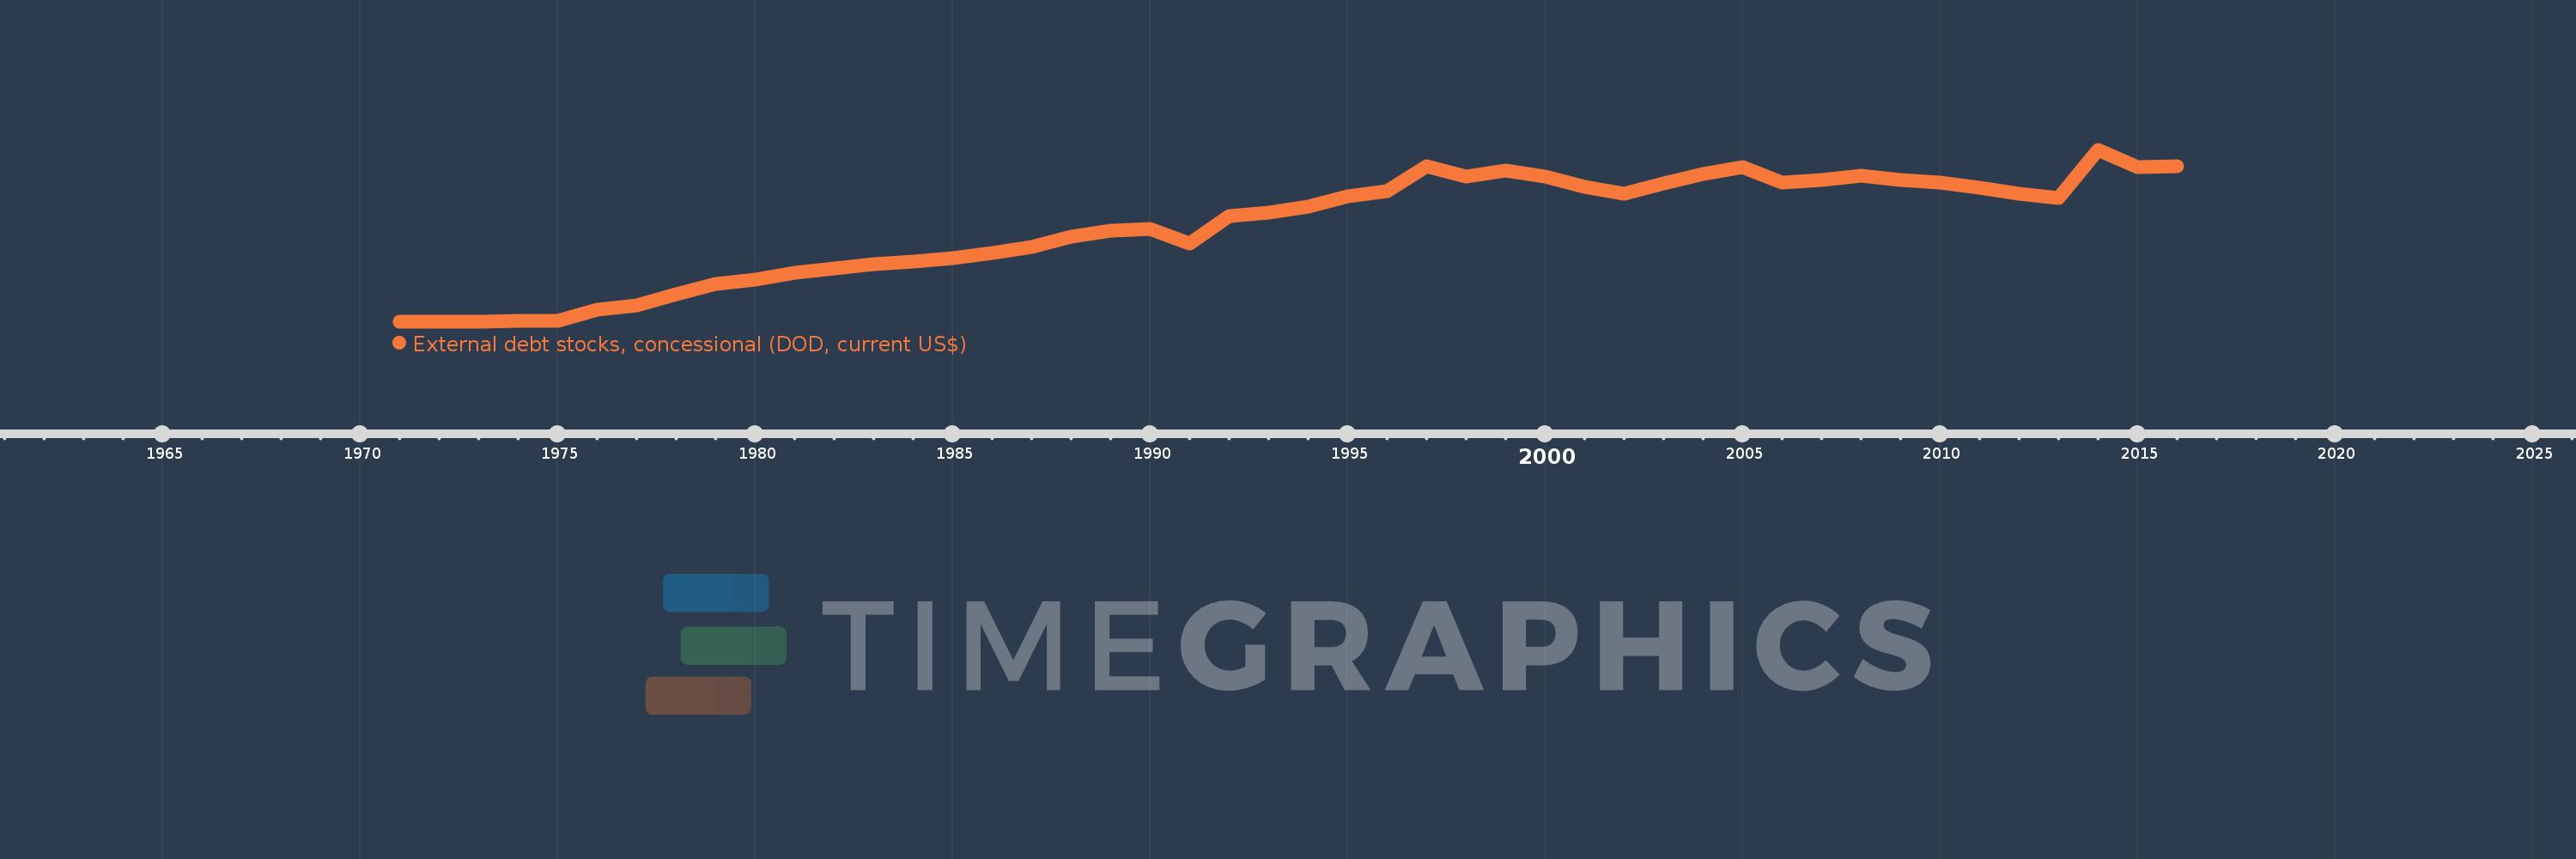
External debt stocks, concessional (DOD, current US$)
2016,2015,2014,2013,2012,2011,2010,2009,2008,2007,2006,2005,2004,2003,2002,2001,2000,1999,1998,1997,1996,1995,1994,1993,1992,1991,1990,1989,1988,1987,1986,1985,1984,1983,1982,1981,1980,1979,1978,1977,1976,1975,1974,1973,1972,1971
Estas estadísticas en otros países:
línea de tiempo (timeline):
En esta escala de tiempo se presenta un gráfico de 1971 y 2016 de Egypt, Arab Rep.. Los datos de 1970 están ausentes. El número de observaciones reales por fecha: 46.
Fuente (nombre):
Indicadores del desarrollo mundial
Fuente (organización):
World Bank, International Debt Statistics.
Categorías:
External Debt
Se ha actualizado:
23 abr 2017 año
Los indicadores de los cambios de valor en los últimos años
Mínimo:
811.712 millones
1 ene 1972 año
Máximo:
26.462 bn
1 ene 2014 año
A la fecha de observación
Valor
Cambio absoluto
El cambio con respecto al valor anterior
1 ene 1971 año
863.592 millones
+863.592 millones
0.0%
1 ene 1972 año
811.712 millones
-51.88 millones
-6.01%
1 ene 1973 año
813.672 millones
+1.96 millones
0.24%
1 ene 1974 año
922.115 millones
+108.443 millones
13.33%
1 ene 1975 año
1.039 bn
+116.854 millones
12.67%
1 ene 1976 año
2.687 bn
+1.648 bn
158.64%
1 ene 1977 año
3.261 bn
+573.653 millones
21.35%
1 ene 1978 año
4.947 bn
+1.686 bn
51.72%
1 ene 1979 año
6.45 bn
+1.503 bn
30.38%
1 ene 1980 año
7.189 bn
+739.121 millones
11.46%
1 ene 1981 año
8.115 bn
+925.951 millones
12.88%
1 ene 1982 año
8.833 bn
+717.598 millones
8.84%
1 ene 1983 año
9.495 bn
+662.195 millones
7.5%
1 ene 1984 año
9.833 bn
+337.84 millones
3.56%
1 ene 1985 año
10.306 bn
+473.246 millones
4.81%
1 ene 1986 año
11.152 bn
+845.562 millones
8.2%
1 ene 1987 año
12.041 bn
+889.459 millones
7.98%
1 ene 1988 año
13.529 bn
+1.487 bn
12.35%
1 ene 1989 año
14.462 bn
+933.229 millones
6.9%
1 ene 1990 año
14.693 bn
+230.815 millones
1.6%
1 ene 1991 año
12.496 bn
-2.197 bn
-14.95%
1 ene 1992 año
16.614 bn
+4.118 bn
32.95%
1 ene 1993 año
17.178 bn
+564.018 millones
3.39%
1 ene 1994 año
18.048 bn
+870.334 millones
5.07%
1 ene 1995 año
19.605 bn
+1.556 bn
8.62%
1 ene 1996 año
20.375 bn
+769.912 millones
3.93%
1 ene 1997 año
24.071 bn
+3.696 bn
18.14%
1 ene 1998 año
22.505 bn
-1.566 bn
-6.51%
1 ene 1999 año
23.386 bn
+881.62 millones
3.92%
1 ene 2000 año
22.461 bn
-925.812 millones
-3.96%
1 ene 2001 año
21.037 bn
-1.423 bn
-6.34%
1 ene 2002 año
19.917 bn
-1.121 bn
-5.33%
1 ene 2003 año
21.449 bn
+1.532 bn
7.69%
1 ene 2004 año
22.875 bn
+1.426 bn
6.65%
1 ene 2005 año
23.878 bn
+1.003 bn
4.39%
1 ene 2006 año
21.639 bn
-2.239 bn
-9.38%
1 ene 2007 año
22.009 bn
+370.428 millones
1.71%
1 ene 2008 año
22.64 bn
+630.629 millones
2.87%
1 ene 2009 año
21.969 bn
-671.082 millones
-2.96%
1 ene 2010 año
21.653 bn
-316.136 millones
-1.44%
1 ene 2011 año
20.85 bn
-803.096 millones
-3.71%
1 ene 2012 año
19.898 bn
-952.021 millones
-4.57%
1 ene 2013 año
19.337 bn
-560.638 millones
-2.82%
1 ene 2014 año
26.462 bn
+7.124 bn
36.84%
1 ene 2015 año
23.977 bn
-2.485 bn
-9.39%
1 ene 2016 año
24.066 bn
+89.078 millones
0.37%
Ranking de los países por los datos estadísticos actuales


Comentarios: