29
/es/
es
AIzaSyAYiBZKx7MnpbEhh9jyipgxe19OcubqV5w
April 1, 2024
124658
Egypt, Arab Rep.
EGY
true
2
1
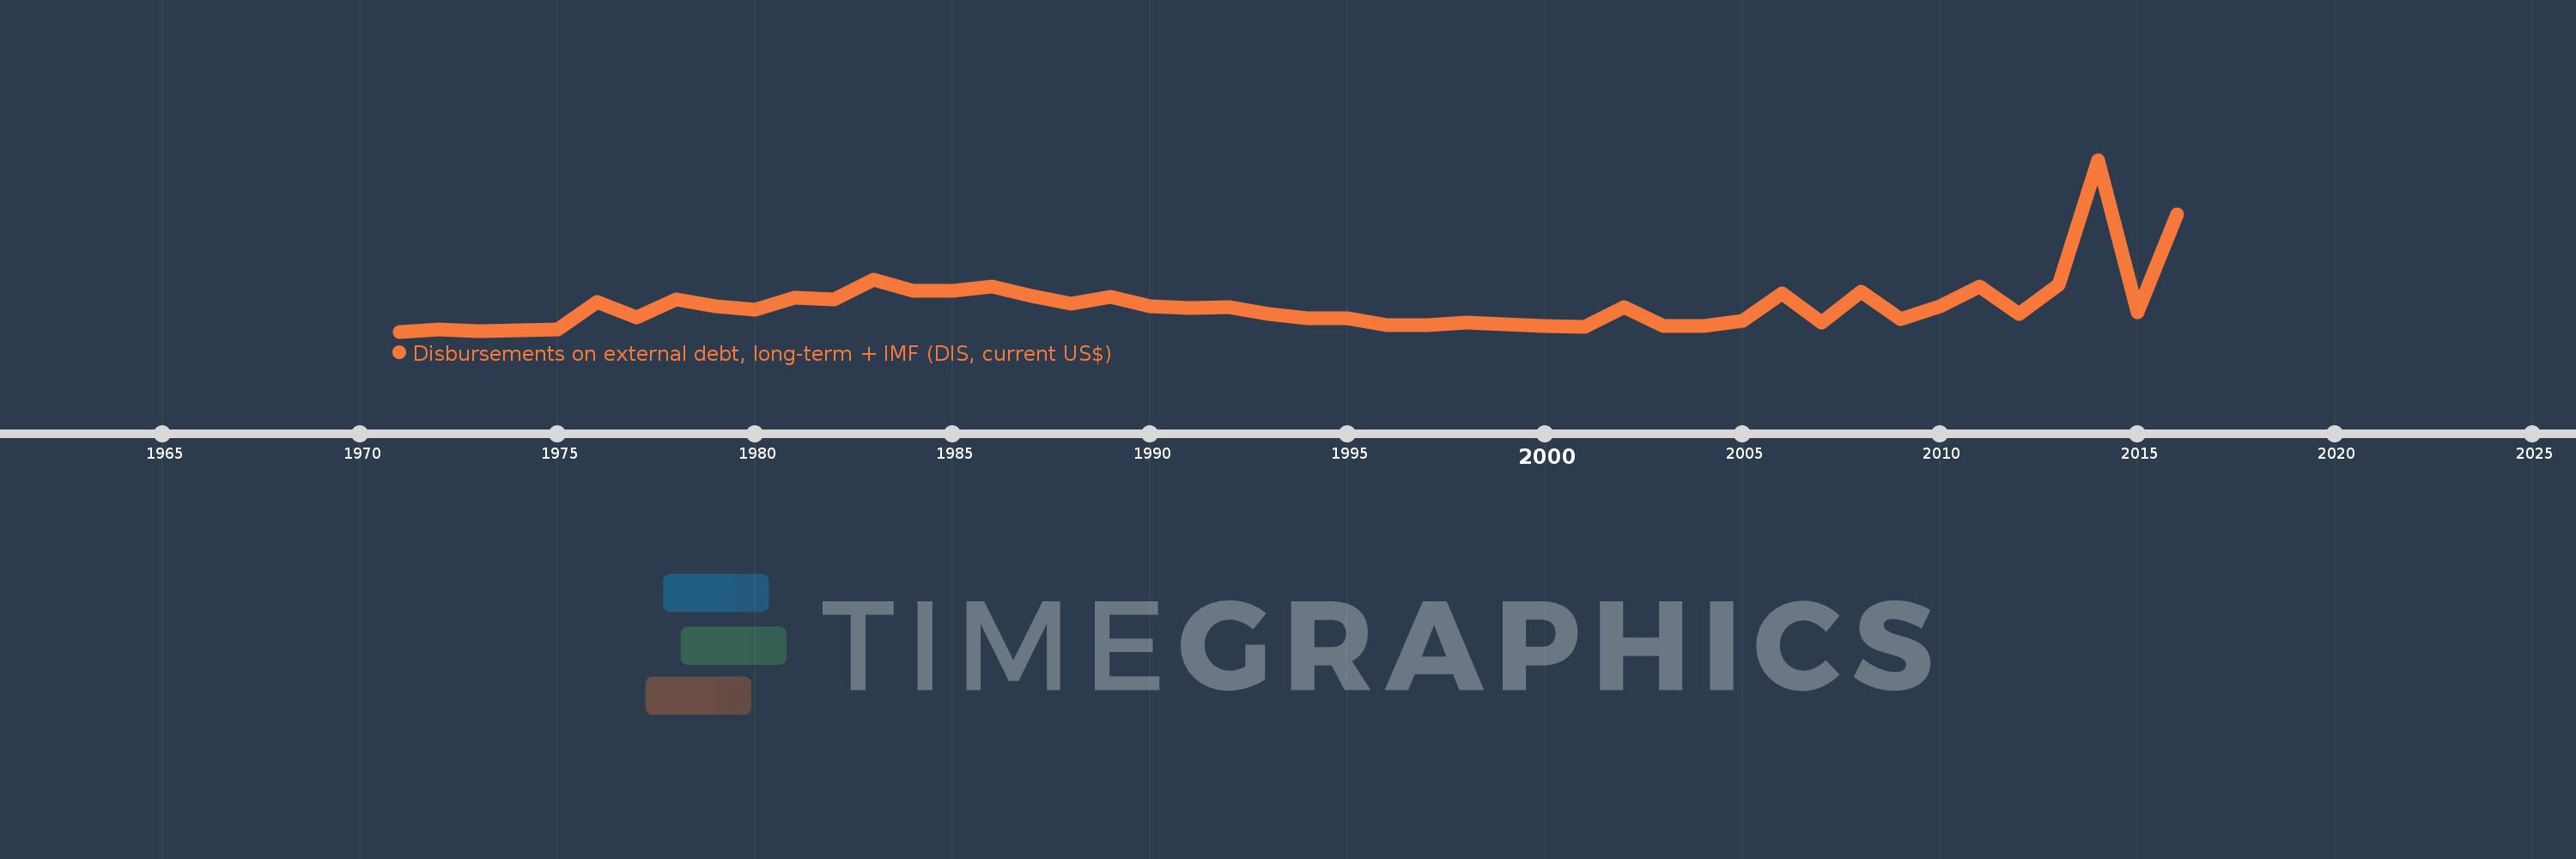
Disbursements on external debt, long-term + IMF (DIS, current US$)
2016,2015,2014,2013,2012,2011,2010,2009,2008,2007,2006,2005,2004,2003,2002,2001,2000,1999,1998,1997,1996,1995,1994,1993,1992,1991,1990,1989,1988,1987,1986,1985,1984,1983,1982,1981,1980,1979,1978,1977,1976,1975,1974,1973,1972,1971
Estas estadísticas en otros países:
línea de tiempo (timeline):
En esta escala de tiempo se presenta un gráfico de 1971 y 2016 de Egypt, Arab Rep.. Los datos de 1970 están ausentes. El número de observaciones reales por fecha: 46.
Fuente (nombre):
Indicadores del desarrollo mundial
Fuente (organización):
World Bank, International Debt Statistics.
Categorías:
External Debt
Se ha actualizado:
23 abr 2017 año
Los indicadores de los cambios de valor en los últimos años
Mínimo:
187.811 millones
1 ene 1971 año
Máximo:
13.145 bn
1 ene 2014 año
A la fecha de observación
Valor
Cambio absoluto
El cambio con respecto al valor anterior
1 ene 1971 año
187.811 millones
+187.811 millones
0.0%
1 ene 1972 año
350.381 millones
+162.57 millones
86.56%
1 ene 1973 año
235.565 millones
-114.816 millones
-32.77%
1 ene 1974 año
291.436 millones
+55.871 millones
23.72%
1 ene 1975 año
368.374 millones
+76.938 millones
26.4%
1 ene 1976 año
2.41 bn
+2.042 bn
554.22%
1 ene 1977 año
1.277 bn
-1.133 bn
-47.0%
1 ene 1978 año
2.611 bn
+1.334 bn
104.42%
1 ene 1979 año
2.131 bn
-480.236 millones
-18.39%
1 ene 1980 año
1.869 bn
-261.527 millones
-12.27%
1 ene 1981 año
2.743 bn
+873.934 millones
46.76%
1 ene 1982 año
2.617 bn
-125.996 millones
-4.59%
1 ene 1983 año
4.105 bn
+1.488 bn
56.87%
1 ene 1984 año
3.247 bn
-857.844 millones
-20.9%
1 ene 1985 año
3.235 bn
-12.32 millones
-0.38%
1 ene 1986 año
3.607 bn
+372.102 millones
11.5%
1 ene 1987 año
2.888 bn
-719.557 millones
-19.95%
1 ene 1988 año
2.299 bn
-588.223 millones
-20.37%
1 ene 1989 año
2.789 bn
+489.21 millones
21.28%
1 ene 1990 año
2.129 bn
-659.637 millones
-23.65%
1 ene 1991 año
1.952 bn
-176.961 millones
-8.31%
1 ene 1992 año
2.037 bn
+85.322 millones
4.37%
1 ene 1993 año
1.491 bn
-546.274 millones
-26.81%
1 ene 1994 año
1.199 bn
-292.37 millones
-19.61%
1 ene 1995 año
1.193 bn
-5.513 millones
-0.46%
1 ene 1996 año
642.273 millones
-550.9 millones
-46.17%
1 ene 1997 año
682.716 millones
+40.443 millones
6.3%
1 ene 1998 año
898.676 millones
+215.96 millones
31.63%
1 ene 1999 año
751.597 millones
-147.079 millones
-16.37%
1 ene 2000 año
582.367 millones
-169.23 millones
-22.52%
1 ene 2001 año
569.311 millones
-13.056 millones
-2.24%
1 ene 2002 año
2.047 bn
+1.477 bn
259.49%
1 ene 2003 año
612.596 millones
-1.434 bn
-70.07%
1 ene 2004 año
621.64 millones
+9.044 millones
1.48%
1 ene 2005 año
1.026 bn
+404.262 millones
65.03%
1 ene 2006 año
3.09 bn
+2.064 bn
201.22%
1 ene 2007 año
838.597 millones
-2.252 bn
-72.86%
1 ene 2008 año
3.188 bn
+2.35 bn
280.18%
1 ene 2009 año
1.133 bn
-2.055 bn
-64.46%
1 ene 2010 año
2.131 bn
+997.511 millones
88.04%
1 ene 2011 año
3.617 bn
+1.486 bn
69.75%
1 ene 2012 año
1.51 bn
-2.106 bn
-58.24%
1 ene 2013 año
3.688 bn
+2.178 bn
144.19%
1 ene 2014 año
13.145 bn
+9.457 bn
256.42%
1 ene 2015 año
1.646 bn
-11.499 bn
-87.48%
1 ene 2016 año
9.04 bn
+7.394 bn
449.27%
Ranking de los países por los datos estadísticos actuales


Comentarios: