29
/es/
es
AIzaSyAYiBZKx7MnpbEhh9jyipgxe19OcubqV5w
April 1, 2024
123587
Ecuador
ECU
true
2
1
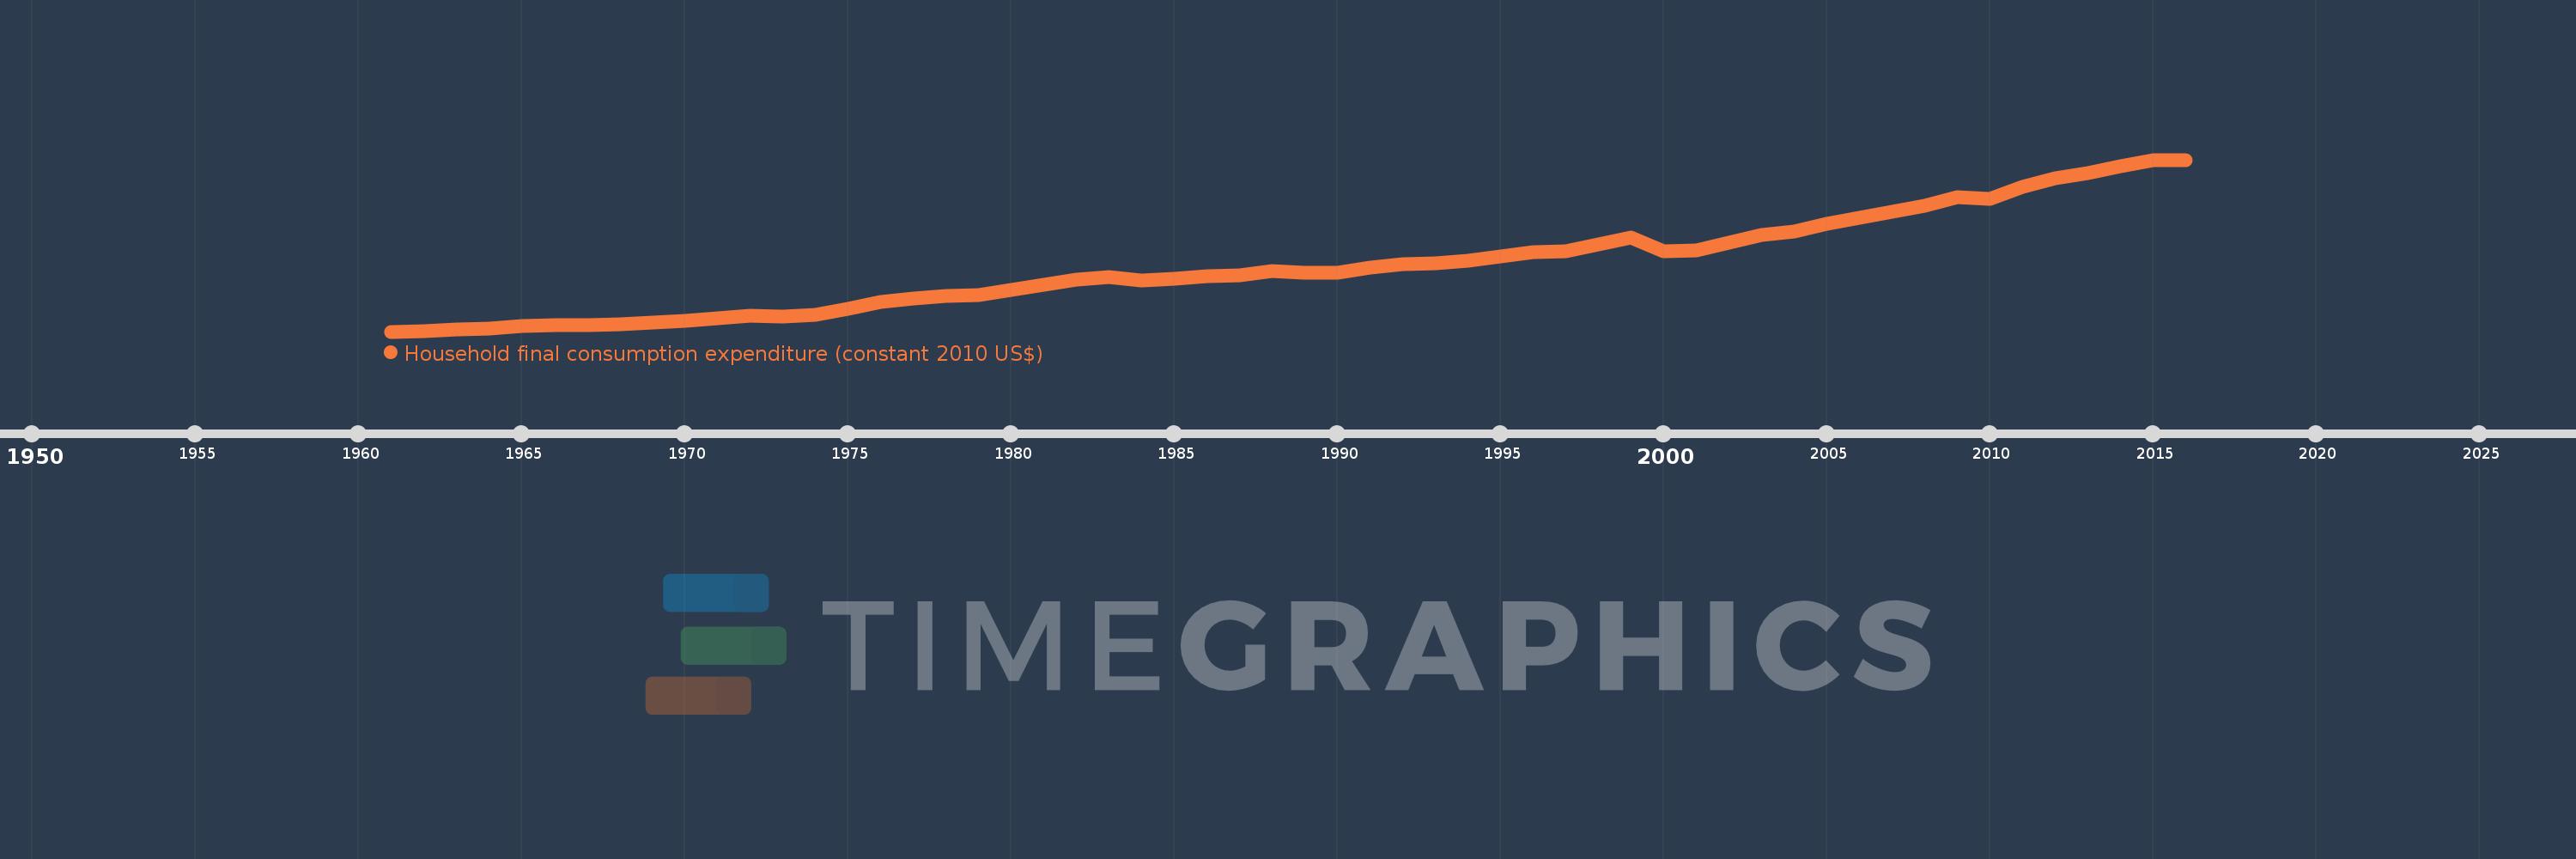
Household final consumption expenditure (constant 2010 US$)
2016,2015,2014,2013,2012,2011,2010,2009,2008,2007,2006,2005,2004,2003,2002,2001,2000,1999,1998,1997,1996,1995,1994,1993,1992,1991,1990,1989,1988,1987,1986,1985,1984,1983,1982,1981,1980,1979,1978,1977,1976,1975,1974,1973,1972,1971,1970,1969,1968,1967,1966,1965,1964,1963,1962,1961
Estas estadísticas en otros países:
AfghanistanAlbaniaAlgeriaAngolaAntigua and BarbudaArab WorldArgentinaArmeniaArubaAustraliaAustriaAzerbaijanBahamas, TheBahrainBangladeshBarbadosBelarusBelgiumBelizeBeninBermudaBhutanBoliviaBosnia and HerzegovinaBotswanaBrazilBrunei DarussalamBulgariaBurkina FasoBurundiCabo VerdeCambodiaCameroonCanadaCaribbean small statesCentral African RepublicCentral Europe and the BalticsChadChileChinaColombiaComorosCongo, Dem. Rep.Congo, Rep.Costa RicaCote d'IvoireCroatiaCubaCyprusCzech RepublicDenmarkDominicaDominican RepublicEarly-demographic dividendEast Asia & PacificEast Asia & Pacific (excluding high income)East Asia & Pacific (IDA & IBRD countries)EcuadorEgypt, Arab Rep.El SalvadorEquatorial GuineaEritreaEstoniaEuro areaEurope & Central AsiaEurope & Central Asia (excluding high income)Europe & Central Asia (IDA & IBRD countries)European UnionFaroe IslandsFinlandFranceGabonGambia, TheGeorgiaGermanyGhanaGreeceGrenadaGuatemalaGuineaGuinea-BissauGuyanaHaitiHeavily indebted poor countries (HIPC)High incomeHondurasHong Kong SAR, ChinaHungaryIBRD onlyIcelandIDA & IBRD totalIDA blendIDA onlyIDA totalIndiaIndonesiaIran, Islamic Rep.IrelandIsraelItalyJamaicaJapanJordanKazakhstanKenyaKorea, Rep.KosovoKuwaitKyrgyz RepublicLao PDRLate-demographic dividendLatin America & Caribbean Latin America & Caribbean (excluding high income)Latin America & the Caribbean (IDA & IBRD countries)LatviaLeast developed countries: UN classificationLebanonLiberiaLithuaniaLow & middle incomeLow incomeLower middle incomeLuxembourgMacao SAR, ChinaMacedonia, FYRMadagascarMalawiMalaysiaMaliMaltaMauritaniaMauritiusMexicoMiddle East & North AfricaMiddle East & North Africa (excluding high income)Middle East & North Africa (IDA & IBRD countries)Middle incomeMoldovaMongoliaMontenegroMoroccoMozambiqueNamibiaNepalNetherlandsNew ZealandNicaraguaNigerNigeriaNorth AmericaNorwayOECD membersOmanOther small statesPakistanPanamaParaguayPeruPhilippinesPolandPortugalPost-demographic dividendPre-demographic dividendPuerto RicoQatarRomaniaRussian FederationRwandaSaudi ArabiaSenegalSerbiaSeychellesSierra LeoneSingaporeSlovak RepublicSloveniaSmall statesSouth AfricaSouth AsiaSouth Asia (IDA & IBRD)South SudanSpainSri LankaSt. Kitts and NevisSt. LuciaSt. Vincent and the GrenadinesSub-Saharan Africa Sub-Saharan Africa (excluding high income)Sub-Saharan Africa (IDA & IBRD countries)SudanSurinameSwazilandSwedenSwitzerlandTajikistanTanzaniaThailandTimor-LesteTogoTongaTrinidad and TobagoTunisiaTurkeyTurkmenistanUgandaUkraineUnited Arab EmiratesUnited KingdomUnited StatesUpper middle incomeUruguayUzbekistanVanuatuVenezuela, RBVietnamWest Bank and GazaWorldYemen, Rep.ZambiaZimbabwe línea de tiempo (timeline):
En esta escala de tiempo se presenta un gráfico de 1961 y 2016 de Ecuador. Los datos de 1960 están ausentes. El número de observaciones reales por fecha: 56.
Fuente (nombre):
Indicadores del desarrollo mundial
Fuente (organización):
World Bank national accounts data, and OECD National Accounts data files.
Categorías:
Economy & Growth
Se ha actualizado:
23 abr 2017 año
Los indicadores de los cambios de valor en los últimos años
Mínimo:
6.123 bn
1 ene 1961 año
Máximo:
51.153 bn
1 ene 2015 año
A la fecha de observación
Valor
Cambio absoluto
El cambio con respecto al valor anterior
1 ene 1961 año
6.123 bn
+6.123 bn
0.0%
1 ene 1962 año
6.283 bn
+160.131 millones
2.62%
1 ene 1963 año
6.672 bn
+388.814 millones
6.19%
1 ene 1964 año
6.923 bn
+251.029 millones
3.76%
1 ene 1965 año
7.635 bn
+711.798 millones
10.28%
1 ene 1966 año
7.767 bn
+132.94 millones
1.74%
1 ene 1967 año
7.822 bn
+54.571 millones
0.7%
1 ene 1968 año
8.082 bn
+260.127 millones
3.33%
1 ene 1969 año
8.467 bn
+384.645 millones
4.76%
1 ene 1970 año
8.928 bn
+461.295 millones
5.45%
1 ene 1971 año
9.7 bn
+771.994 millones
8.65%
1 ene 1972 año
10.204 bn
+503.547 millones
5.19%
1 ene 1973 año
9.995 bn
-208.554 millones
-2.04%
1 ene 1974 año
10.485 bn
+489.506 millones
4.9%
1 ene 1975 año
12.141 bn
+1.657 bn
15.8%
1 ene 1976 año
13.852 bn
+1.71 bn
14.09%
1 ene 1977 año
14.866 bn
+1.014 bn
7.32%
1 ene 1978 año
15.418 bn
+552.606 millones
3.72%
1 ene 1979 año
15.772 bn
+353.659 millones
2.29%
1 ene 1980 año
17.02 bn
+1.248 bn
7.91%
1 ene 1981 año
18.355 bn
+1.335 bn
7.84%
1 ene 1982 año
19.708 bn
+1.353 bn
7.37%
1 ene 1983 año
20.33 bn
+622.867 millones
3.16%
1 ene 1984 año
19.573 bn
-757.402 millones
-3.73%
1 ene 1985 año
19.928 bn
+355.321 millones
1.82%
1 ene 1986 año
20.732 bn
+803.514 millones
4.03%
1 ene 1987 año
20.783 bn
+50.891 millones
0.25%
1 ene 1988 año
22.108 bn
+1.325 bn
6.38%
1 ene 1989 año
21.493 bn
-615.233 millones
-2.78%
1 ene 1990 año
21.523 bn
+30.955 millones
0.14%
1 ene 1991 año
22.845 bn
+1.321 bn
6.14%
1 ene 1992 año
23.769 bn
+923.827 millones
4.04%
1 ene 1993 año
24.014 bn
+245.044 millones
1.03%
1 ene 1994 año
24.774 bn
+760.275 millones
3.17%
1 ene 1995 año
25.883 bn
+1.109 bn
4.48%
1 ene 1996 año
26.915 bn
+1.031 bn
3.98%
1 ene 1997 año
27.255 bn
+340.382 millones
1.26%
1 ene 1998 año
28.879 bn
+1.624 bn
5.96%
1 ene 1999 año
30.867 bn
+1.988 bn
6.88%
1 ene 2000 año
27.102 bn
-3.765 bn
-12.2%
1 ene 2001 año
27.32 bn
+217.923 millones
0.8%
1 ene 2002 año
29.364 bn
+2.044 bn
7.48%
1 ene 2003 año
31.442 bn
+2.078 bn
7.08%
1 ene 2004 año
32.385 bn
+943.736 millones
3.0%
1 ene 2005 año
34.47 bn
+2.084 bn
6.44%
1 ene 2006 año
35.996 bn
+1.526 bn
4.43%
1 ene 2007 año
37.562 bn
+1.567 bn
4.35%
1 ene 2008 año
39.154 bn
+1.592 bn
4.24%
1 ene 2009 año
41.269 bn
+2.115 bn
5.4%
1 ene 2010 año
40.861 bn
-408.579 millones
-0.99%
1 ene 2011 año
44.012 bn
+3.151 bn
7.71%
1 ene 2012 año
46.269 bn
+2.257 bn
5.13%
1 ene 2013 año
47.599 bn
+1.329 bn
2.87%
1 ene 2014 año
49.462 bn
+1.864 bn
3.92%
1 ene 2015 año
51.153 bn
+1.69 bn
3.42%
1 ene 2016 año
51.079 bn
-73.764 millones
-0.14%
Ranking de los países por los datos estadísticos actuales


Comentarios: