29
/es/
es
AIzaSyAYiBZKx7MnpbEhh9jyipgxe19OcubqV5w
April 1, 2024
121945
Dominican Republic
DOM
true
2
1
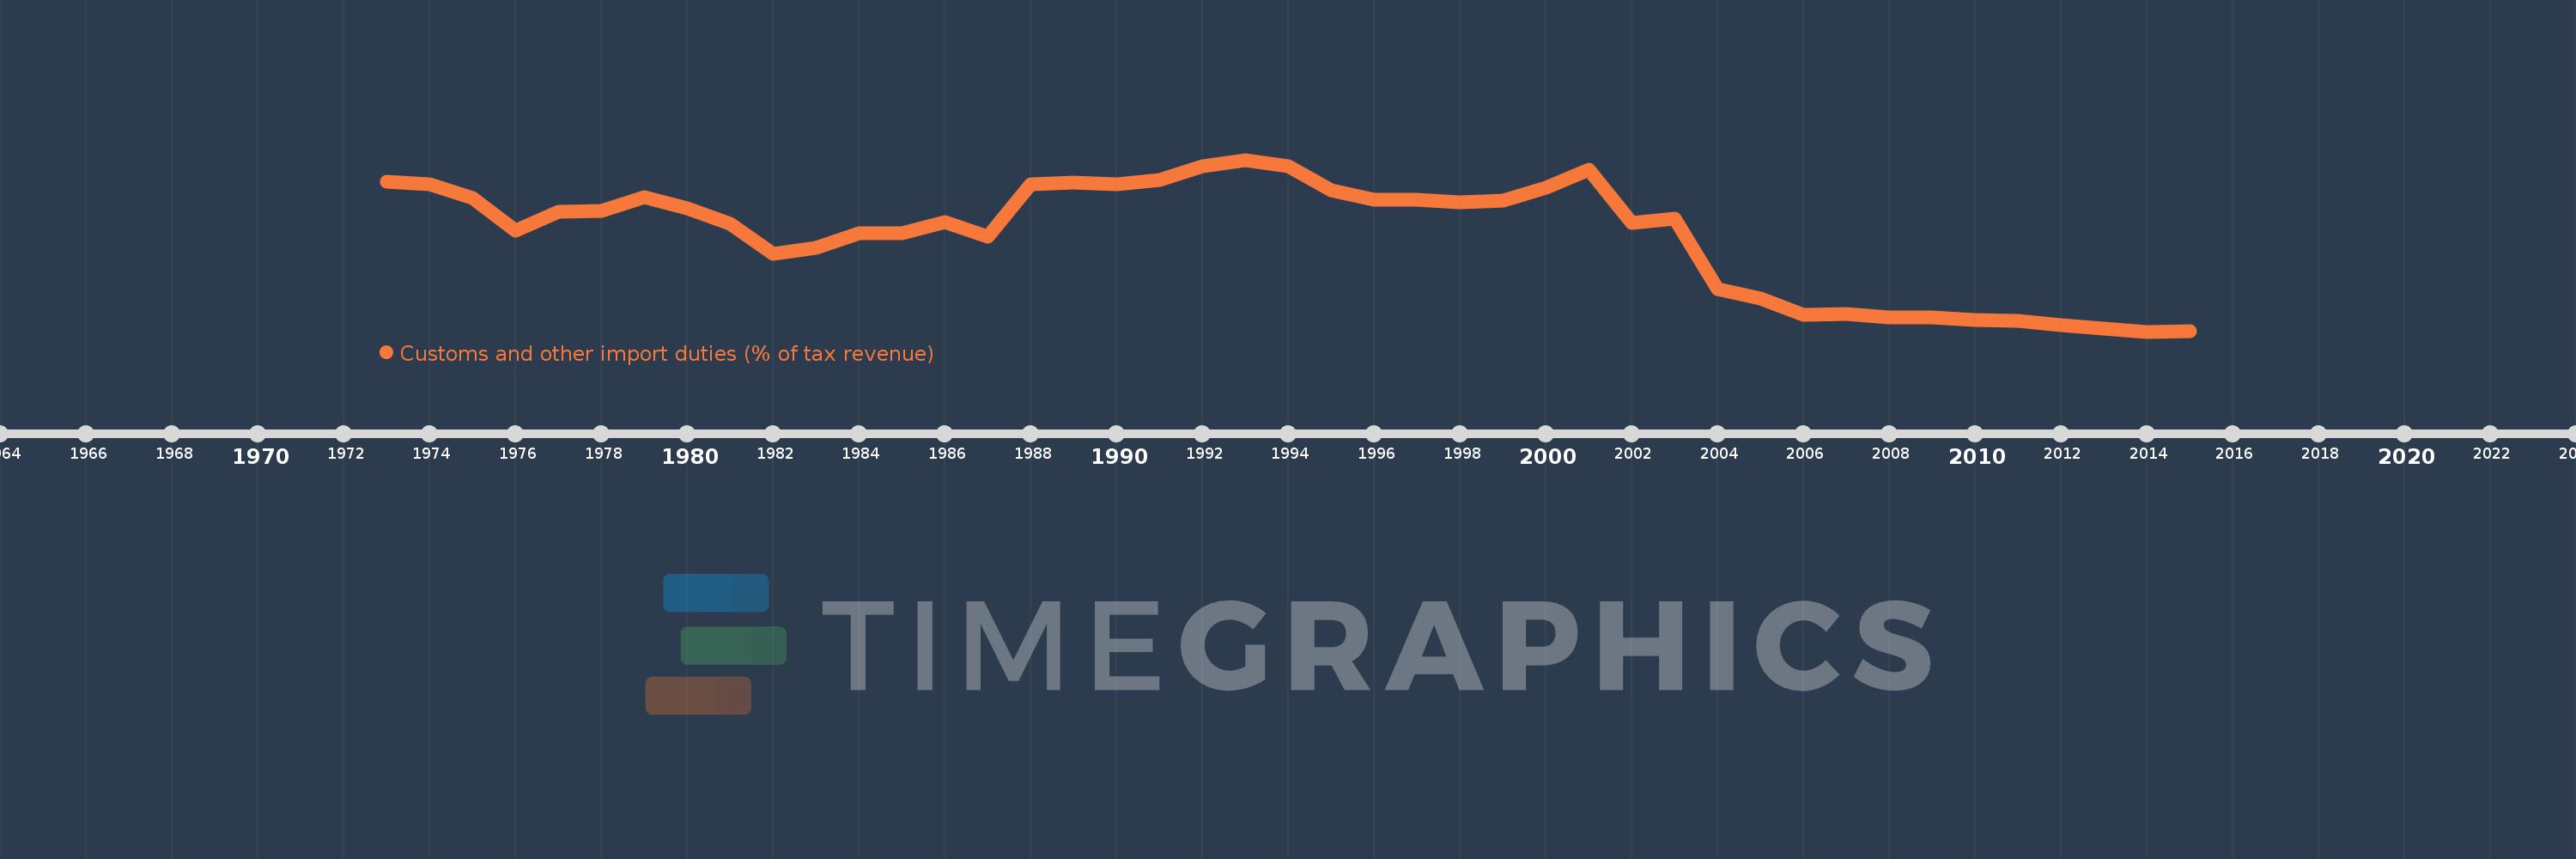
Customs and other import duties (% of tax revenue)
2015,2014,2013,2012,2011,2010,2009,2008,2007,2006,2005,2004,2003,2002,2001,2000,1999,1998,1997,1996,1995,1994,1993,1992,1991,1990,1989,1988,1987,1986,1985,1984,1983,1982,1981,1980,1979,1978,1977,1976,1975,1974,1973
Estas estadísticas en otros países:
AfghanistanAlbaniaAlgeriaAngolaAntigua and BarbudaArgentinaArmeniaAustraliaAustriaAzerbaijanBahamas, TheBahrainBangladeshBarbadosBelarusBelizeBeninBhutanBoliviaBosnia and HerzegovinaBotswanaBrazilBulgariaBurkina FasoBurundiCabo VerdeCambodiaCentral African RepublicChileChinaColombiaCongo, Dem. Rep.Congo, Rep.Costa RicaCote d'IvoireCroatiaCyprusCzech RepublicDenmarkDominicaDominican RepublicEgypt, Arab Rep.El SalvadorEquatorial GuineaEstoniaEthiopiaFijiFinlandFranceGambia, TheGeorgiaGermanyGhanaGreeceGrenadaGuatemalaHondurasHong Kong SAR, ChinaHungaryIcelandIndiaIndonesiaIran, Islamic Rep.IraqIrelandIsraelItalyJamaicaJapanJordanKazakhstanKenyaKiribatiKorea, Rep.KuwaitKyrgyz RepublicLao PDRLatviaLebanonLiberiaLithuaniaLuxembourgMacedonia, FYRMadagascarMalawiMalaysiaMaldivesMaliMaltaMauritiusMexicoMicronesia, Fed. Sts.MoldovaMongoliaMoroccoMozambiqueMyanmarNamibiaNepalNetherlandsNew ZealandNicaraguaNorwayOmanPakistanPanamaPapua New GuineaParaguayPeruPhilippinesPolandPortugalQatarRomaniaRussian FederationRwandaSamoaSan MarinoSao Tome and PrincipeSenegalSerbiaSeychellesSierra LeoneSingaporeSlovak RepublicSloveniaSolomon IslandsSouth AfricaSpainSri LankaSt. Kitts and NevisSt. LuciaSurinameSwazilandSwedenSwitzerlandSyrian Arab RepublicTajikistanTanzaniaThailandTogoTrinidad and TobagoTunisiaTurkeyUgandaUkraineUnited Arab EmiratesUnited KingdomUnited StatesUruguayVanuatuVenezuela, RBVietnamWest Bank and GazaYemen, Rep.ZambiaZimbabwe línea de tiempo (timeline):
En esta escala de tiempo se presenta un gráfico de 1973 y 2015 de Dominican Republic. Los datos de 1972 están ausentes. El número de observaciones reales por fecha: 43.
Fuente (nombre):
Indicadores del desarrollo mundial
Fuente (organización):
International Monetary Fund, Government Finance Statistics Yearbook and data files.
Categorías:
Public Sector, Trade
Se ha actualizado:
23 abr 2017 año
Los indicadores de los cambios de valor en los últimos años
Mínimo:
5.392
1 ene 2014 año
Máximo:
48.679
1 ene 1993 año
A la fecha de observación
Valor
Cambio absoluto
El cambio con respecto al valor anterior
1 ene 1973 año
43.153
+43.153
0.0%
1 ene 1974 año
42.558
-0.595
-1.38%
1 ene 1975 año
39.132
-3.425
-8.05%
1 ene 1976 año
30.822
-8.31
-21.24%
1 ene 1977 año
35.547
+4.724
15.33%
1 ene 1978 año
35.733
+0.186
0.52%
1 ene 1979 año
39.356
+3.623
10.14%
1 ene 1980 año
36.466
-2.891
-7.34%
1 ene 1981 año
32.602
-3.864
-10.6%
1 ene 1982 año
24.973
-7.629
-23.4%
1 ene 1983 año
26.425
+1.452
5.82%
1 ene 1984 año
30.277
+3.852
14.58%
1 ene 1985 año
30.15
-0.127
-0.42%
1 ene 1986 año
33.081
+2.931
9.72%
1 ene 1987 año
29.367
-3.715
-11.23%
1 ene 1988 año
42.446
+13.079
44.54%
1 ene 1989 año
43.012
+0.566
1.33%
1 ene 1990 año
42.406
-0.606
-1.41%
1 ene 1991 año
43.578
+1.172
2.76%
1 ene 1992 año
46.96
+3.382
7.76%
1 ene 1993 año
48.679
+1.719
3.66%
1 ene 1994 año
47.039
-1.64
-3.37%
1 ene 1995 año
40.974
-6.065
-12.89%
1 ene 1996 año
38.671
-2.303
-5.62%
1 ene 1997 año
38.531
-0.14
-0.36%
1 ene 1998 año
37.971
-0.56
-1.45%
1 ene 1999 año
38.453
+0.482
1.27%
1 ene 2000 año
41.735
+3.282
8.53%
1 ene 2001 año
46.105
+4.369
10.47%
1 ene 2002 año
32.859
-13.245
-28.73%
1 ene 2003 año
33.792
+0.933
2.84%
1 ene 2004 año
16.185
-17.607
-52.11%
1 ene 2005 año
13.663
-2.522
-15.58%
1 ene 2006 año
9.715
-3.948
-28.9%
1 ene 2007 año
9.891
+0.176
1.81%
1 ene 2008 año
8.947
-0.944
-9.54%
1 ene 2009 año
9.002
+0.054
0.61%
1 ene 2010 año
8.339
-0.662
-7.36%
1 ene 2011 año
8.051
-0.288
-3.46%
1 ene 2012 año
6.935
-1.116
-13.86%
1 ene 2013 año
6.087
-0.848
-12.23%
1 ene 2014 año
5.392
-0.695
-11.42%
1 ene 2015 año
5.446
+0.054
1.0%
Ranking de los países por los datos estadísticos actuales


Comentarios: