29
/es/
es
AIzaSyAYiBZKx7MnpbEhh9jyipgxe19OcubqV5w
April 1, 2024
116297
Cuba
CUB
true
2
1
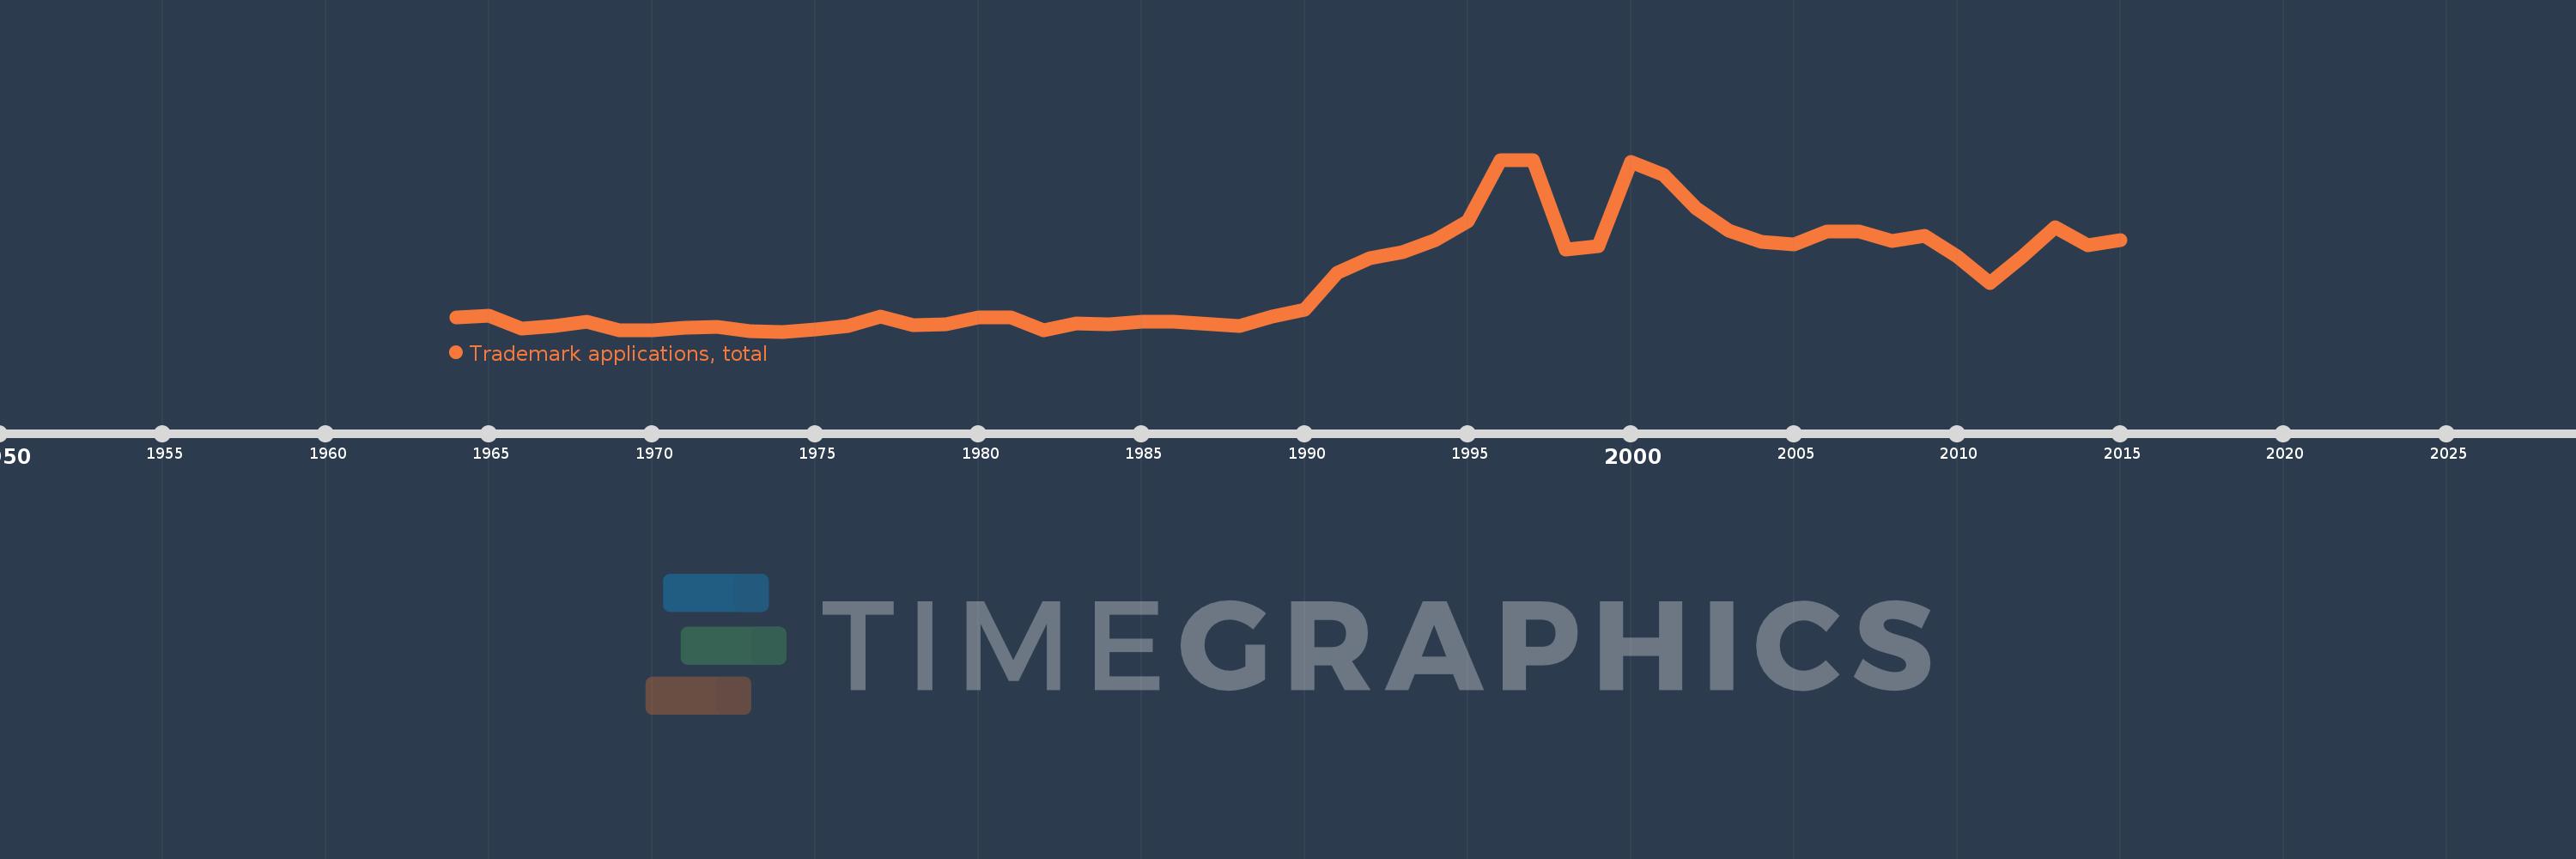
Trademark applications, total
2015,2014,2013,2012,2011,2010,2009,2008,2007,2006,2005,2004,2003,2002,2001,2000,1999,1998,1997,1996,1995,1994,1993,1992,1991,1990,1989,1988,1986,1985,1984,1983,1982,1981,1980,1979,1978,1977,1976,1975,1974,1973,1972,1971,1970,1969,1968,1967,1966,1965,1964
Estas estadísticas en otros países:
AlbaniaAlgeriaAndorraAngolaAntigua and BarbudaArab WorldArgentinaArmeniaArubaAustraliaAustriaAzerbaijanBahamas, TheBahrainBangladeshBarbadosBelarusBelgiumBelizeBhutanBoliviaBosnia and HerzegovinaBotswanaBrazilBrunei DarussalamBulgariaBurkina FasoBurundiCabo VerdeCambodiaCanadaCaribbean small statesCentral Europe and the BalticsChileChinaColombiaComorosCongo, Dem. Rep.Costa RicaCroatiaCubaCuracaoCyprusCzech RepublicDenmarkDjiboutiDominicaDominican RepublicEarly-demographic dividendEast Asia & PacificEast Asia & Pacific (excluding high income)East Asia & Pacific (IDA & IBRD countries)EcuadorEgypt, Arab Rep.El SalvadorEquatorial GuineaEstoniaEthiopiaEuro areaEurope & Central AsiaEurope & Central Asia (excluding high income)Europe & Central Asia (IDA & IBRD countries)European UnionFijiFinlandFranceGambia, TheGeorgiaGermanyGhanaGreeceGrenadaGuatemalaGuineaGuinea-BissauGuyanaHaitiHigh incomeHondurasHong Kong SAR, ChinaHungaryIBRD onlyIcelandIDA & IBRD totalIDA blendIDA onlyIDA totalIndiaIndonesiaIran, Islamic Rep.IraqIrelandIsraelItalyJamaicaJapanJordanKazakhstanKenyaKiribatiKorea, Dem. People’s Rep.Korea, Rep.KuwaitKyrgyz RepublicLao PDRLate-demographic dividendLatin America & Caribbean Latin America & Caribbean (excluding high income)Latin America & the Caribbean (IDA & IBRD countries)LatviaLeast developed countries: UN classificationLebanonLesothoLiberiaLibyaLiechtensteinLithuaniaLow & middle incomeLower middle incomeLuxembourgMacao SAR, ChinaMacedonia, FYRMadagascarMalawiMalaysiaMaldivesMaliMaltaMauritiusMexicoMiddle East & North AfricaMiddle East & North Africa (excluding high income)Middle East & North Africa (IDA & IBRD countries)Middle incomeMoldovaMonacoMongoliaMontenegroMoroccoMozambiqueMyanmarNamibiaNepalNetherlandsNew ZealandNicaraguaNigeriaNorth AmericaNorwayOECD membersOmanOther small statesPacific island small statesPakistanPanamaPapua New GuineaParaguayPeruPhilippinesPolandPortugalPost-demographic dividendQatarRomaniaRussian FederationRwandaSamoaSan MarinoSao Tome and PrincipeSaudi ArabiaSerbiaSeychellesSierra LeoneSingaporeSint Maarten (Dutch part)Slovak RepublicSloveniaSmall statesSolomon IslandsSomaliaSouth AfricaSouth AsiaSouth Asia (IDA & IBRD)SpainSri LankaSt. LuciaSt. Vincent and the GrenadinesSudanSurinameSwazilandSwedenSwitzerlandSyrian Arab RepublicTajikistanTanzaniaThailandTongaTrinidad and TobagoTunisiaTurkeyTurkmenistanTuvaluUgandaUkraineUnited Arab EmiratesUnited KingdomUnited StatesUpper middle incomeUruguayUzbekistanVenezuela, RBVietnamWorldYemen, Rep.ZambiaZimbabwe línea de tiempo (timeline):
En esta escala de tiempo se presenta un gráfico de 1964 y 2015 de Cuba. Los datos de 1963 están ausentes. El número de observaciones reales por fecha: 51.
Fuente (nombre):
Indicadores del desarrollo mundial
Fuente (organización):
World Intellectual Property Organization (WIPO), World Intellectual Property Indicators and www.wipo.int/econ_stat. The International Bureau of WIPO assumes no responsibility with respect to the transformation of these data.
Categorías:
Science & Technology
Se ha actualizado:
23 abr 2017 año
Los indicadores de los cambios de valor en los últimos años
Mínimo:
228.0
1 ene 1974 año
Máximo:
4.367 mil
1 ene 1996 año
A la fecha de observación
Valor
Cambio absoluto
El cambio con respecto al valor anterior
1 ene 1964 año
564.0
+564.0
0.0%
1 ene 1965 año
617.0
+53.0
9.4%
1 ene 1966 año
305.0
-312.0
-50.57%
1 ene 1967 año
363.0
+58.0
19.02%
1 ene 1968 año
474.0
+111.0
30.58%
1 ene 1969 año
263.0
-211.0
-44.51%
1 ene 1970 año
252.0
-11.0
-4.18%
1 ene 1971 año
331.0
+79.0
31.35%
1 ene 1972 año
349.0
+18.0
5.44%
1 ene 1973 año
240.0
-109.0
-31.23%
1 ene 1974 año
228.0
-12.0
-5.0%
1 ene 1975 año
285.0
+57.0
25.0%
1 ene 1976 año
363.0
+78.0
27.37%
1 ene 1977 año
588.0
+225.0
61.98%
1 ene 1978 año
384.0
-204.0
-34.69%
1 ene 1979 año
406.0
+22.0
5.73%
1 ene 1980 año
568.0
+162.0
39.9%
1 ene 1981 año
571.0
+3.0
0.53%
1 ene 1982 año
264.0
-307.0
-53.77%
1 ene 1983 año
423.0
+159.0
60.23%
1 ene 1984 año
413.0
-10.0
-2.36%
1 ene 1985 año
463.0
+50.0
12.11%
1 ene 1986 año
468.0
+5.0
1.08%
1 ene 1988 año
369.0
-99.0
-21.15%
1 ene 1989 año
590.0
+221.0
59.89%
1 ene 1990 año
747.0
+157.0
26.61%
1 ene 1991 año
1.637 mil
+890.0
119.14%
1 ene 1992 año
2.002 mil
+365.0
22.3%
1 ene 1993 año
2.151 mil
+149.0
7.44%
1 ene 1994 año
2.434 mil
+283.0
13.16%
1 ene 1995 año
2.896 mil
+462.0
18.98%
1 ene 1996 año
4.367 mil
+1.471 mil
50.79%
1 ene 1997 año
4.353 mil
-14.0
-0.32%
1 ene 1998 año
2.206 mil
-2.147 mil
-49.32%
1 ene 1999 año
2.277 mil
+71.0
3.22%
1 ene 2000 año
4.31 mil
+2.033 mil
89.28%
1 ene 2001 año
4.003 mil
-307.0
-7.12%
1 ene 2002 año
3.199 mil
-804.0
-20.08%
1 ene 2003 año
2.665 mil
-534.0
-16.69%
1 ene 2004 año
2.391 mil
-274.0
-10.28%
1 ene 2005 año
2.332 mil
-59.0
-2.47%
1 ene 2006 año
2.635 mil
+303.0
12.99%
1 ene 2007 año
2.634 mil
-1.0
-0.04%
1 ene 2008 año
2.407 mil
-227.0
-8.62%
1 ene 2009 año
2.54 mil
+133.0
5.53%
1 ene 2010 año
2.042 mil
-498.0
-19.61%
1 ene 2011 año
1.389 mil
-653.0
-31.98%
1 ene 2012 año
2.041 mil
+652.0
46.94%
1 ene 2013 año
2.739 mil
+698.0
34.2%
1 ene 2014 año
2.301 mil
-438.0
-15.99%
1 ene 2015 año
2.425 mil
+124.0
5.39%
Ranking de los países por los datos estadísticos actuales


Comentarios: