29
/es/
es
AIzaSyAYiBZKx7MnpbEhh9jyipgxe19OcubqV5w
April 1, 2024
113290
Cote d'Ivoire
CIV
true
2
1
Broad money (current LCU)
2016,2015,2014,2013,2012,2011,2010,2009,2008,2007,2006,2005,2004,2003,2002,2001,2000,1999,1998,1997,1996,1995,1994,1993,1992,1991,1990,1989,1988,1987,1986,1985,1984,1983,1982,1981,1980,1979,1978,1977,1976,1975,1974,1973,1972,1971,1970,1969,1968,1967,1966,1965,1964,1963
Estas estadísticas en otros países:
AfghanistanAlbaniaAlgeriaAngolaAntigua and BarbudaArgentinaArmeniaArubaAustraliaAzerbaijanBahamas, TheBahrainBangladeshBarbadosBelarusBelizeBeninBhutanBoliviaBosnia and HerzegovinaBotswanaBrazilBrunei DarussalamBulgariaBurkina FasoBurundiCabo VerdeCambodiaCameroonCanadaCentral African RepublicChadChileChinaColombiaComorosCongo, Dem. Rep.Congo, Rep.Costa RicaCote d'IvoireCroatiaCzech RepublicDenmarkDjiboutiDominicaDominican RepublicEcuadorEgypt, Arab Rep.El SalvadorEquatorial GuineaEritreaEstoniaEthiopiaEuro areaFijiGabonGambia, TheGeorgiaGhanaGrenadaGuatemalaGuineaGuinea-BissauGuyanaHaitiHondurasHong Kong SAR, ChinaHungaryIcelandIndiaIndonesiaIran, Islamic Rep.IraqIsraelJamaicaJapanJordanKazakhstanKenyaKorea, Rep.KuwaitKyrgyz RepublicLao PDRLatviaLebanonLesothoLiberiaLibyaLithuaniaMacao SAR, ChinaMacedonia, FYRMadagascarMalawiMalaysiaMaldivesMaliMauritaniaMauritiusMexicoMicronesia, Fed. Sts.MoldovaMongoliaMoroccoMozambiqueMyanmarNamibiaNepalNew ZealandNicaraguaNigerNigeriaNorwayOmanPakistanPanamaPapua New GuineaParaguayPeruPhilippinesPolandQatarRomaniaRussian FederationRwandaSamoaSao Tome and PrincipeSaudi ArabiaSenegalSerbiaSeychellesSierra LeoneSingaporeSlovak RepublicSolomon IslandsSouth AfricaSouth SudanSri LankaSt. Kitts and NevisSt. LuciaSt. Vincent and the GrenadinesSudanSurinameSwazilandSwedenSwitzerlandSyrian Arab RepublicTajikistanTanzaniaThailandTimor-LesteTogoTongaTrinidad and TobagoTunisiaTurkeyUgandaUkraineUnited Arab EmiratesUnited KingdomUnited StatesUruguayVanuatuVenezuela, RBVietnamWest Bank and GazaYemen, Rep.ZambiaZimbabwe línea de tiempo (timeline):
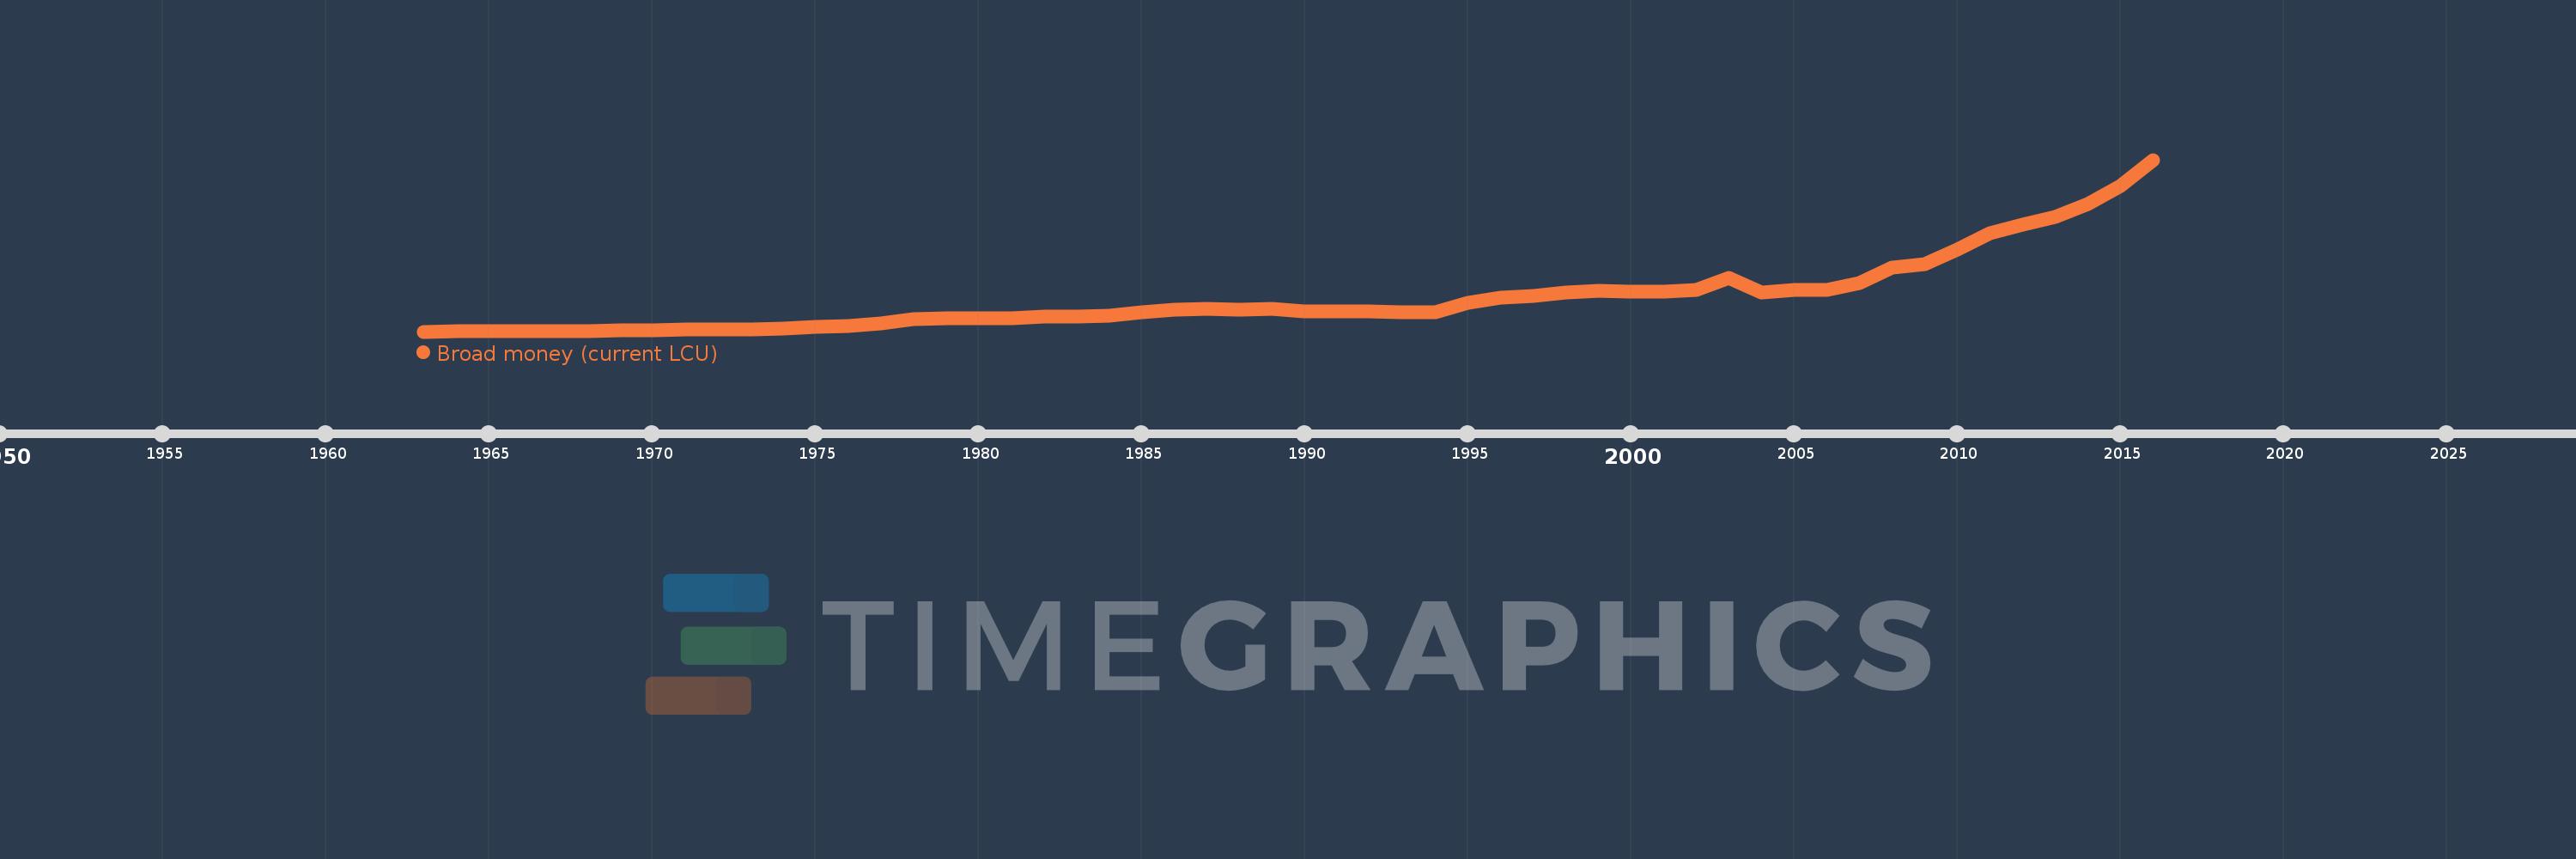
En esta escala de tiempo se presenta un gráfico de 1963 y 2016 de Cote d'Ivoire. Los datos de 1962 están ausentes. El número de observaciones reales por fecha: 54.
Fuente (nombre):
Indicadores del desarrollo mundial
Fuente (organización):
International Monetary Fund, International Financial Statistics and data files.
Categorías:
Financial Sector
Se ha actualizado:
23 abr 2017 año
Los indicadores de los cambios de valor en los últimos años
En promedio:
1.422 billones
Mínimo:
31.78 bn
1 ene 1963 año
Máximo:
7.032 billones
1 ene 2016 año
A la fecha de observación
Valor
Cambio absoluto
El cambio con respecto al valor anterior
1 ene 1963 año
31.78 bn
+31.78 bn
0.0%
1 ene 1964 año
36.32 bn
+4.54 bn
14.29%
1 ene 1965 año
49.49 bn
+13.17 bn
36.26%
1 ene 1966 año
48.86 bn
-630.0 millones
-1.27%
1 ene 1967 año
53.95 bn
+5.09 bn
10.42%
1 ene 1968 año
58.23 bn
+4.28 bn
7.93%
1 ene 1969 año
72.54 bn
+14.31 bn
24.57%
1 ene 1970 año
91.92 bn
+19.38 bn
26.72%
1 ene 1971 año
106.78 bn
+14.86 bn
16.17%
1 ene 1972 año
117.6 bn
+10.82 bn
10.13%
1 ene 1973 año
122.83 bn
+5.23 bn
4.45%
1 ene 1974 año
147.91 bn
+25.08 bn
20.42%
1 ene 1975 año
223.21 bn
+75.3 bn
50.91%
1 ene 1976 año
244.56 bn
+21.35 bn
9.56%
1 ene 1977 año
349.75 bn
+105.19 bn
43.01%
1 ene 1978 año
524.49 bn
+174.74 bn
49.96%
1 ene 1979 año
581.61 bn
+57.12 bn
10.89%
1 ene 1980 año
566.16 bn
-15.45 bn
-2.66%
1 ene 1981 año
581.82 bn
+15.66 bn
2.77%
1 ene 1982 año
639.65 bn
+57.83 bn
9.94%
1 ene 1983 año
660.34 bn
+20.69 bn
3.23%
1 ene 1984 año
691.95 bn
+31.61 bn
4.79%
1 ene 1985 año
826.05 bn
+134.1 bn
19.38%
1 ene 1986 año
939.444 bn
+113.394 bn
13.73%
1 ene 1987 año
964.895 bn
+25.45 bn
2.71%
1 ene 1988 año
930.319 bn
-34.576 bn
-3.58%
1 ene 1989 año
944.004 bn
+13.685 bn
1.47%
1 ene 1990 año
867.726 bn
-76.278 bn
-8.08%
1 ene 1991 año
845.409 bn
-22.317 bn
-2.57%
1 ene 1992 año
846.385 bn
+976.6 millones
0.12%
1 ene 1993 año
836.352 bn
-10.034 bn
-1.19%
1 ene 1994 año
824.958 bn
-11.393 bn
-1.36%
1 ene 1995 año
1.211 billones
+385.946 bn
46.78%
1 ene 1996 año
1.43 billones
+218.953 bn
18.08%
1 ene 1997 año
1.486 billones
+56.145 bn
3.93%
1 ene 1998 año
1.608 billones
+121.672 bn
8.19%
1 ene 1999 año
1.704 billones
+96.735 bn
6.02%
1 ene 2000 año
1.676 billones
-28.679 bn
-1.68%
1 ene 2001 año
1.646 billones
-29.467 bn
-1.76%
1 ene 2002 año
1.721 billones
+75.024 bn
4.56%
1 ene 2003 año
2.234 billones
+512.579 bn
29.78%
1 ene 2004 año
1.616 billones
-618.319 bn
-27.68%
1 ene 2005 año
1.721 billones
+105.103 bn
6.51%
1 ene 2006 año
1.72 billones
-189.559 millones
-0.01%
1 ene 2007 año
2.0 billones
+279.153 bn
16.23%
1 ene 2008 año
2.636 billones
+636.32 bn
31.82%
1 ene 2009 año
2.797 billones
+160.807 bn
6.1%
1 ene 2010 año
3.379 billones
+582.683 bn
20.83%
1 ene 2011 año
4.024 billones
+644.615 bn
19.07%
1 ene 2012 año
4.407 billones
+382.756 bn
9.51%
1 ene 2013 año
4.688 billones
+281.051 bn
6.38%
1 ene 2014 año
5.23 billones
+542.446 bn
11.57%
1 ene 2015 año
5.969 billones
+739.06 bn
14.13%
1 ene 2016 año
7.032 billones
+1.063 billones
17.81%
Ranking de los países por los datos estadísticos actuales


Comentarios: