29
/es/
es
AIzaSyAYiBZKx7MnpbEhh9jyipgxe19OcubqV5w
April 1, 2024
112033
Costa Rica
CRI
true
2
1
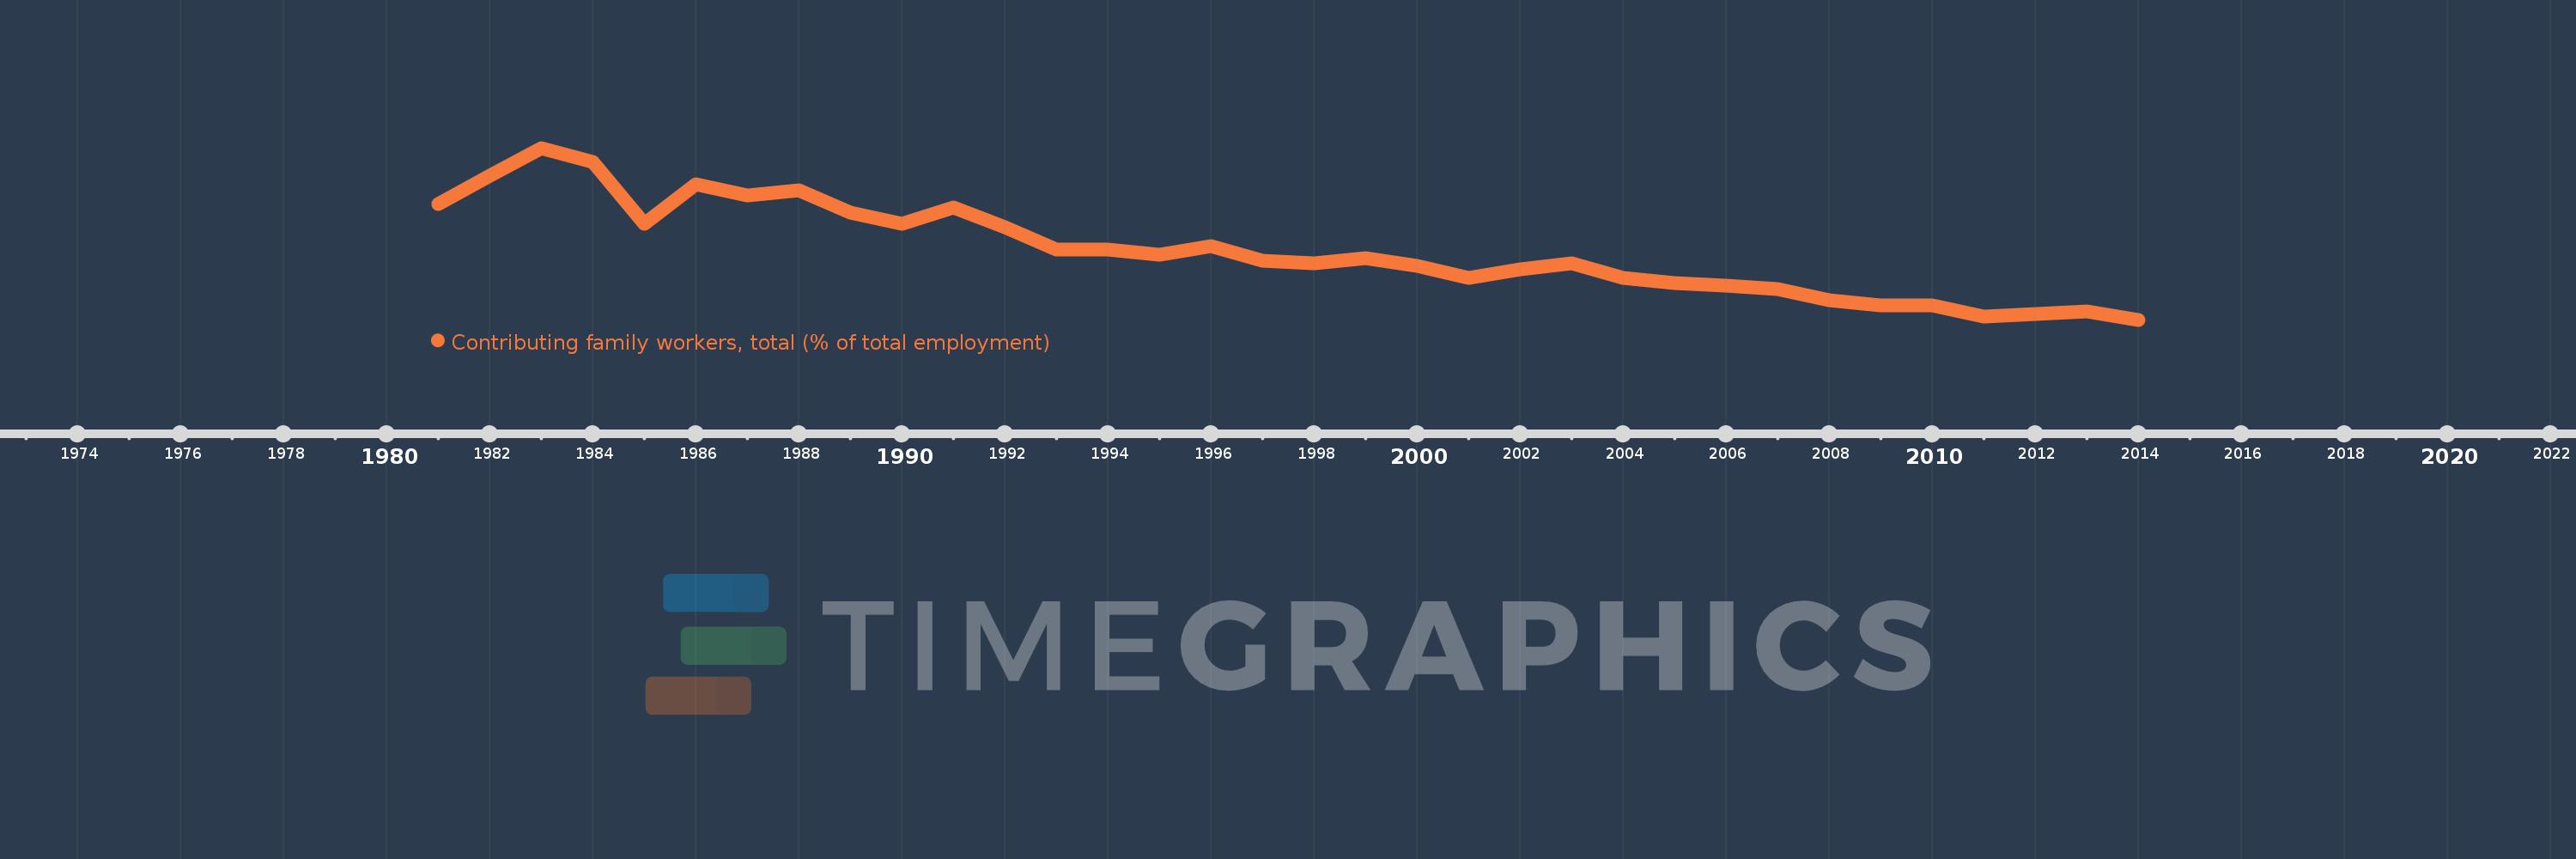
Contributing family workers, total (% of total employment)
2014,2013,2012,2011,2010,2009,2008,2007,2006,2005,2004,2003,2002,2001,2000,1999,1998,1997,1996,1995,1994,1993,1992,1991,1990,1989,1988,1987,1986,1985,1984,1983,1982,1981
Estas estadísticas en otros países:
AlbaniaAlgeriaAmerican SamoaAntigua and BarbudaArgentinaArmeniaArubaAustraliaAustriaAzerbaijanBahamas, TheBahrainBangladeshBarbadosBelarusBelgiumBelizeBeninBermudaBhutanBoliviaBosnia and HerzegovinaBotswanaBrazilBritish Virgin IslandsBrunei DarussalamBulgariaBurkina FasoBurundiCabo VerdeCambodiaCameroonCanadaCaribbean small statesCayman IslandsCentral Europe and the BalticsChadChileColombiaCongo, Rep.Costa RicaCote d'IvoireCroatiaCyprusCzech RepublicDenmarkDominicaDominican RepublicEarly-demographic dividendEcuadorEgypt, Arab Rep.El SalvadorEquatorial GuineaEstoniaEthiopiaEuro areaEurope & Central AsiaEurope & Central Asia (excluding high income)Europe & Central Asia (IDA & IBRD countries)European UnionFijiFinlandFranceFrench PolynesiaGabonGambia, TheGeorgiaGermanyGhanaGreeceGrenadaGuamGuatemalaGuineaHaitiHigh incomeHondurasHong Kong SAR, ChinaHungaryIcelandIndiaIndonesiaIran, Islamic Rep.IrelandIsraelItalyJamaicaJapanJordanKazakhstanKenyaKiribatiKorea, Rep.KosovoKuwaitKyrgyz RepublicLao PDRLatin America & Caribbean Latin America & Caribbean (excluding high income)Latin America & the Caribbean (IDA & IBRD countries)LatviaLebanonLesothoLiberiaLithuaniaLower middle incomeLuxembourgMacao SAR, ChinaMacedonia, FYRMadagascarMalawiMalaysiaMaldivesMaliMaltaMarshall IslandsMauritiusMexicoMiddle East & North AfricaMiddle East & North Africa (excluding high income)Middle East & North Africa (IDA & IBRD countries)MoldovaMongoliaMontenegroMoroccoMozambiqueNamibiaNepalNetherlandsNew CaledoniaNew ZealandNicaraguaNigerNorth AmericaNorwayOECD membersPakistanPanamaParaguayPeruPhilippinesPolandPortugalPost-demographic dividendPuerto RicoQatarRomaniaRussian FederationRwandaSamoaSan MarinoSao Tome and PrincipeSaudi ArabiaSenegalSerbiaSeychellesSierra LeoneSingaporeSlovak RepublicSloveniaSouth AfricaSouth AsiaSouth Asia (IDA & IBRD)SpainSri LankaSt. Kitts and NevisSt. LuciaSt. Vincent and the GrenadinesSurinameSwazilandSwedenSwitzerlandSyrian Arab RepublicTajikistanTanzaniaThailandTimor-LesteTogoTongaTrinidad and TobagoTunisiaTurkeyTuvaluUgandaUkraineUnited Arab EmiratesUnited KingdomUnited StatesUruguayVanuatuVenezuela, RBVietnamWest Bank and GazaYemen, Rep.ZambiaZimbabwe línea de tiempo (timeline):
En esta escala de tiempo se presenta un gráfico de 1981 y 2014 de Costa Rica. Los datos de 1980 están ausentes. El número de observaciones reales por fecha: 34.
Fuente (nombre):
Indicadores del desarrollo mundial
Fuente (organización):
International Labour Organization, Key Indicators of the Labour Market database.
Categorías:
Social Protection & Labor
Se ha actualizado:
23 abr 2017 año
Los indicadores de los cambios de valor en los últimos años
A la fecha de observación
Valor
Cambio absoluto
El cambio con respecto al valor anterior
1 ene 1981 año
5.2
+5.2
0.0%
1 ene 1982 año
6.2
+1.0
19.23%
1 ene 1983 año
7.2
+1.0
16.13%
1 ene 1984 año
6.7
-0.5
-6.94%
1 ene 1985 año
4.5
-2.2
-32.84%
1 ene 1986 año
5.9
+1.4
31.11%
1 ene 1987 año
5.5
-0.4
-6.78%
1 ene 1988 año
5.7
+0.2
3.64%
1 ene 1989 año
4.9
-0.8
-14.04%
1 ene 1990 año
4.5
-0.4
-8.16%
1 ene 1991 año
5.1
+0.6
13.33%
1 ene 1992 año
4.4
-0.7
-13.73%
1 ene 1993 año
3.6
-0.8
-18.18%
1 ene 1994 año
3.6
0.0
0.0%
1 ene 1995 año
3.4
-0.2
-5.56%
1 ene 1996 año
3.7
+0.3
8.82%
1 ene 1997 año
3.2
-0.5
-13.51%
1 ene 1998 año
3.1
-0.1
-3.13%
1 ene 1999 año
3.3
+0.2
6.45%
1 ene 2000 año
3.0
-0.3
-9.09%
1 ene 2001 año
2.6
-0.4
-13.33%
1 ene 2002 año
2.9
+0.3
11.54%
1 ene 2003 año
3.1
+0.2
6.9%
1 ene 2004 año
2.6
-0.5
-16.13%
1 ene 2005 año
2.4
-0.2
-7.69%
1 ene 2006 año
2.3
-0.1
-4.17%
1 ene 2007 año
2.2
-0.1
-4.35%
1 ene 2008 año
1.8
-0.4
-18.18%
1 ene 2009 año
1.6
-0.2
-11.11%
1 ene 2010 año
1.6
0.0
0.0%
1 ene 2011 año
1.2
-0.4
-25.0%
1 ene 2012 año
1.3
+0.1
8.33%
1 ene 2013 año
1.4
+0.1
7.69%
1 ene 2014 año
1.1
-0.3
-21.43%
Ranking de los países por los datos estadísticos actuales


Comentarios: