29
/es/
es
AIzaSyAYiBZKx7MnpbEhh9jyipgxe19OcubqV5w
April 1, 2024
111994
Costa Rica
CRI
true
2
1
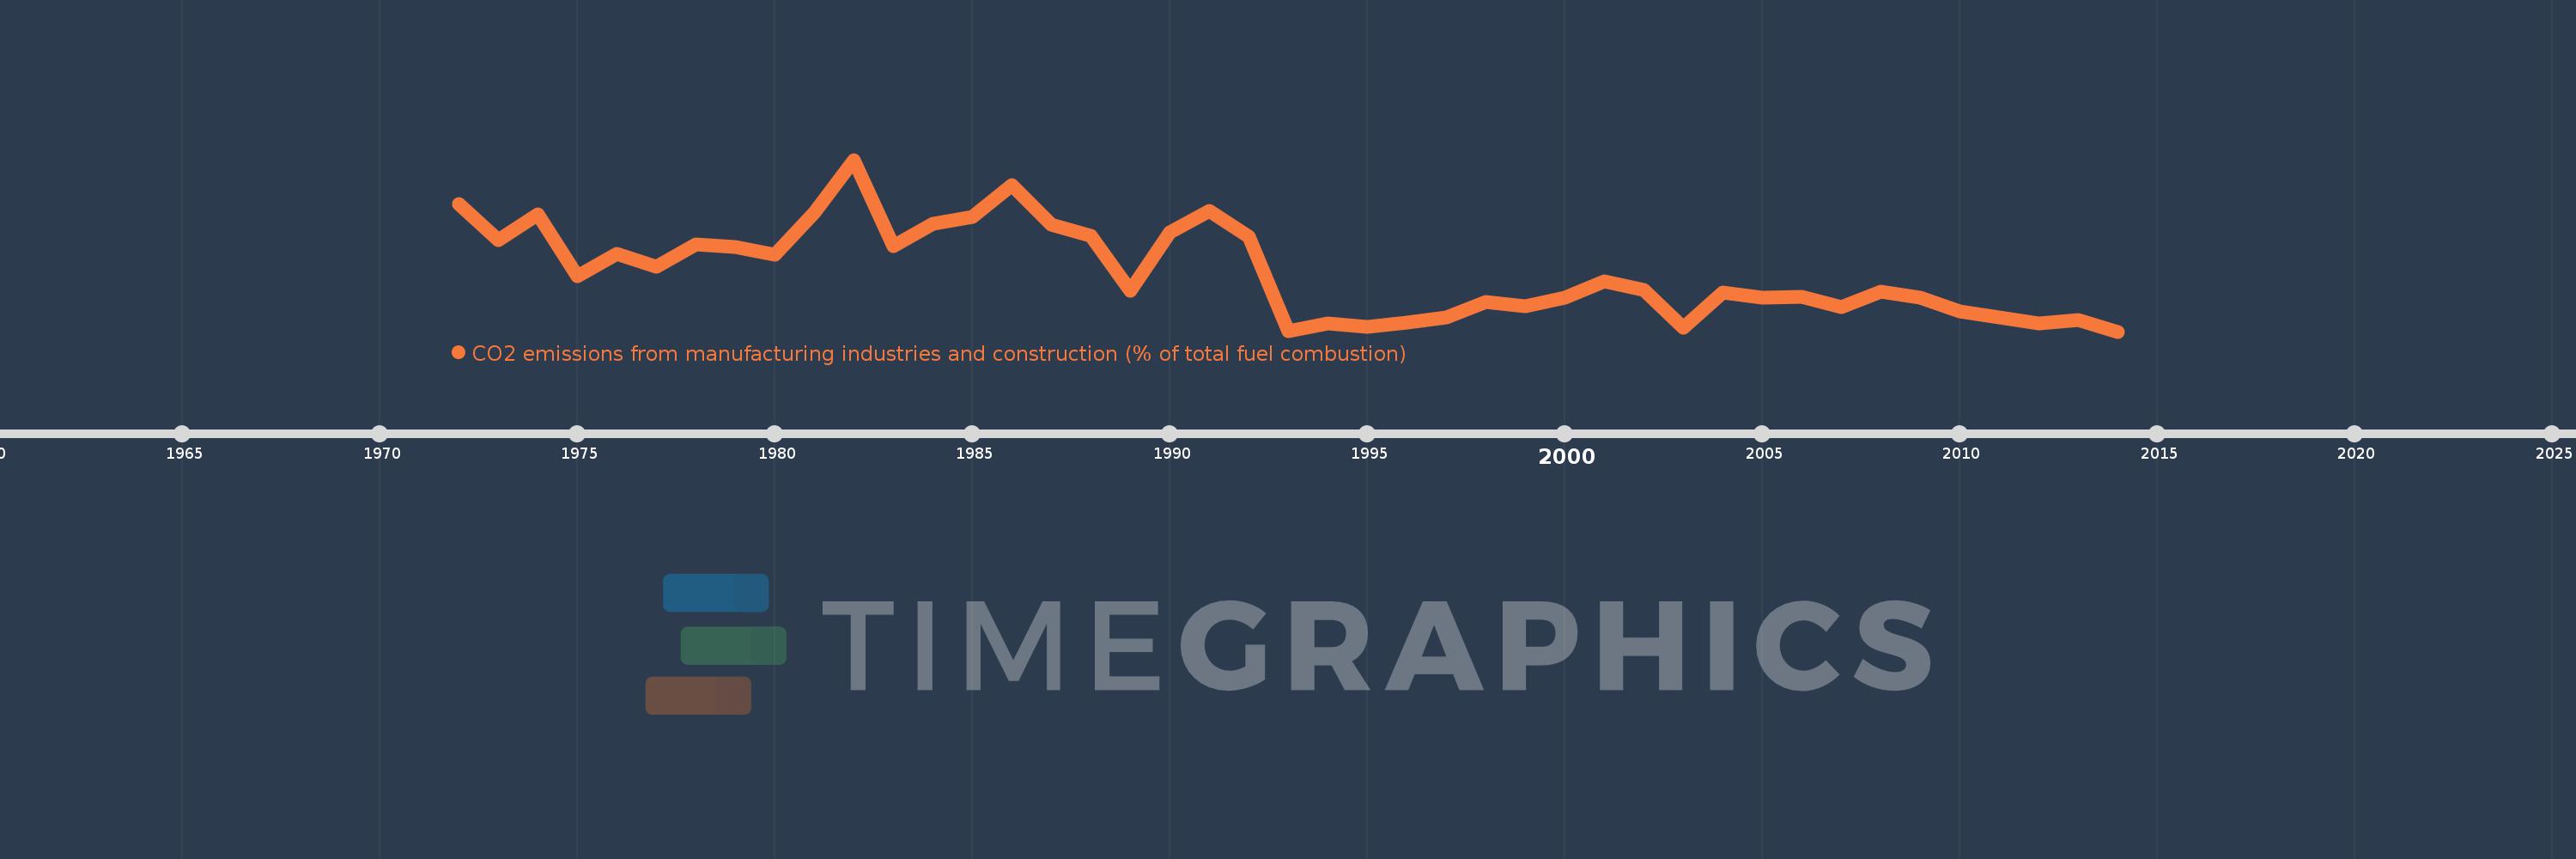
CO2 emissions from manufacturing industries and construction (% of total fuel combustion)
2014,2013,2012,2011,2010,2009,2008,2007,2006,2005,2004,2003,2002,2001,2000,1999,1998,1997,1996,1995,1994,1993,1992,1991,1990,1989,1988,1987,1986,1985,1984,1983,1982,1981,1980,1979,1978,1977,1976,1975,1974,1973,1972
Estas estadísticas en otros países:
AlbaniaAlgeriaAngolaArab WorldArgentinaArmeniaAustraliaAustriaAzerbaijanBahrainBangladeshBelarusBelgiumBeninBoliviaBosnia and HerzegovinaBotswanaBrazilBrunei DarussalamBulgariaCambodiaCameroonCanadaCaribbean small statesCentral Europe and the BalticsChileChinaColombiaCongo, Dem. Rep.Congo, Rep.Costa RicaCote d'IvoireCroatiaCubaCuracaoCyprusCzech RepublicDenmarkDominican RepublicEarly-demographic dividendEast Asia & PacificEast Asia & Pacific (excluding high income)East Asia & Pacific (IDA & IBRD countries)EcuadorEgypt, Arab Rep.El SalvadorEritreaEstoniaEthiopiaEuro areaEurope & Central AsiaEurope & Central Asia (excluding high income)Europe & Central Asia (IDA & IBRD countries)European UnionFinlandFragile and conflict affected situationsFranceGabonGeorgiaGermanyGhanaGibraltarGreeceGuatemalaHaitiHeavily indebted poor countries (HIPC)High incomeHondurasHong Kong SAR, ChinaHungaryIBRD onlyIcelandIDA & IBRD totalIDA blendIDA onlyIDA totalIndiaIndonesiaIran, Islamic Rep.IraqIrelandIsraelItalyJamaicaJapanJordanKazakhstanKenyaKorea, Dem. People’s Rep.Korea, Rep.KosovoKuwaitKyrgyz RepublicLate-demographic dividendLatin America & Caribbean Latin America & Caribbean (excluding high income)Latin America & the Caribbean (IDA & IBRD countries)LatviaLeast developed countries: UN classificationLebanonLibyaLithuaniaLow & middle incomeLow incomeLower middle incomeLuxembourgMacedonia, FYRMalaysiaMaltaMauritiusMexicoMiddle East & North AfricaMiddle East & North Africa (excluding high income)Middle East & North Africa (IDA & IBRD countries)Middle incomeMoldovaMongoliaMontenegroMoroccoMozambiqueMyanmarNamibiaNepalNetherlandsNew ZealandNicaraguaNigerNigeriaNorth AmericaNorwayOECD membersOmanOther small statesPakistanPanamaParaguayPeruPhilippinesPolandPortugalPost-demographic dividendPre-demographic dividendQatarRomaniaRussian FederationSaudi ArabiaSenegalSerbiaSingaporeSlovak RepublicSloveniaSmall statesSouth AfricaSouth AsiaSouth Asia (IDA & IBRD)South SudanSpainSri LankaSub-Saharan Africa Sub-Saharan Africa (excluding high income)Sub-Saharan Africa (IDA & IBRD countries)SudanSwedenSwitzerlandSyrian Arab RepublicTajikistanTanzaniaThailandTogoTrinidad and TobagoTunisiaTurkeyTurkmenistanUkraineUnited Arab EmiratesUnited KingdomUnited StatesUpper middle incomeUruguayUzbekistanVenezuela, RBVietnamWorldYemen, Rep.ZambiaZimbabwe línea de tiempo (timeline):
En esta escala de tiempo se presenta un gráfico de 1972 y 2014 de Costa Rica. Los datos de 1971 están ausentes. El número de observaciones reales por fecha: 43.
Fuente (nombre):
Indicadores del desarrollo mundial
Fuente (organización):
IEA Statistics © OECD/IEA 2014 (http://www.iea.org/stats/index.asp), subject to https://www.iea.org/t&c/termsandconditions/
Categorías:
Environment
Se ha actualizado:
23 abr 2017 año
Los indicadores de los cambios de valor en los últimos años
Mínimo:
14.165
1 ene 2014 año
Máximo:
31.188
1 ene 1982 año
A la fecha de observación
Valor
Cambio absoluto
El cambio con respecto al valor anterior
1 ene 1972 año
26.772
+26.772
0.0%
1 ene 1973 año
23.239
-3.532
-13.19%
1 ene 1974 año
25.767
+2.527
10.88%
1 ene 1975 año
19.62
-6.147
-23.85%
1 ene 1976 año
21.839
+2.219
11.31%
1 ene 1977 año
20.556
-1.284
-5.88%
1 ene 1978 año
22.807
+2.251
10.95%
1 ene 1979 año
22.541
-0.266
-1.17%
1 ene 1980 año
21.811
-0.73
-3.24%
1 ene 1981 año
25.926
+4.115
18.87%
1 ene 1982 año
31.188
+5.262
20.3%
1 ene 1983 año
22.619
-8.569
-27.48%
1 ene 1984 año
24.855
+2.236
9.89%
1 ene 1985 año
25.543
+0.688
2.77%
1 ene 1986 año
28.718
+3.174
12.43%
1 ene 1987 año
24.757
-3.961
-13.79%
1 ene 1988 año
23.636
-1.121
-4.53%
1 ene 1989 año
18.182
-5.455
-23.08%
1 ene 1990 año
23.954
+5.773
31.75%
1 ene 1991 año
26.154
+2.199
9.18%
1 ene 1992 año
23.551
-2.603
-9.95%
1 ene 1993 año
14.249
-9.302
-39.5%
1 ene 1994 año
14.961
+0.712
5.0%
1 ene 1995 año
14.607
-0.354
-2.37%
1 ene 1996 año
15.09
+0.483
3.31%
1 ene 1997 año
15.588
+0.497
3.3%
1 ene 1998 año
17.115
+1.527
9.8%
1 ene 1999 año
16.703
-0.412
-2.41%
1 ene 2000 año
17.544
+0.841
5.03%
1 ene 2001 año
19.111
+1.567
8.93%
1 ene 2002 año
18.33
-0.781
-4.09%
1 ene 2003 año
14.542
-3.788
-20.67%
1 ene 2004 año
18.045
+3.503
24.09%
1 ene 2005 año
17.514
-0.531
-2.94%
1 ene 2006 año
17.647
+0.133
0.76%
1 ene 2007 año
16.583
-1.064
-6.03%
1 ene 2008 año
18.141
+1.558
9.4%
1 ene 2009 año
17.515
-0.626
-3.45%
1 ene 2010 año
16.195
-1.32
-7.54%
1 ene 2011 año
15.582
-0.613
-3.78%
1 ene 2012 año
14.941
-0.642
-4.12%
1 ene 2013 año
15.351
+0.41
2.74%
1 ene 2014 año
14.165
-1.185
-7.72%
Ranking de los países por los datos estadísticos actuales


Comentarios: