29
/es/
es
AIzaSyAYiBZKx7MnpbEhh9jyipgxe19OcubqV5w
April 1, 2024
110791
Congo, Rep.
COG
true
2
1
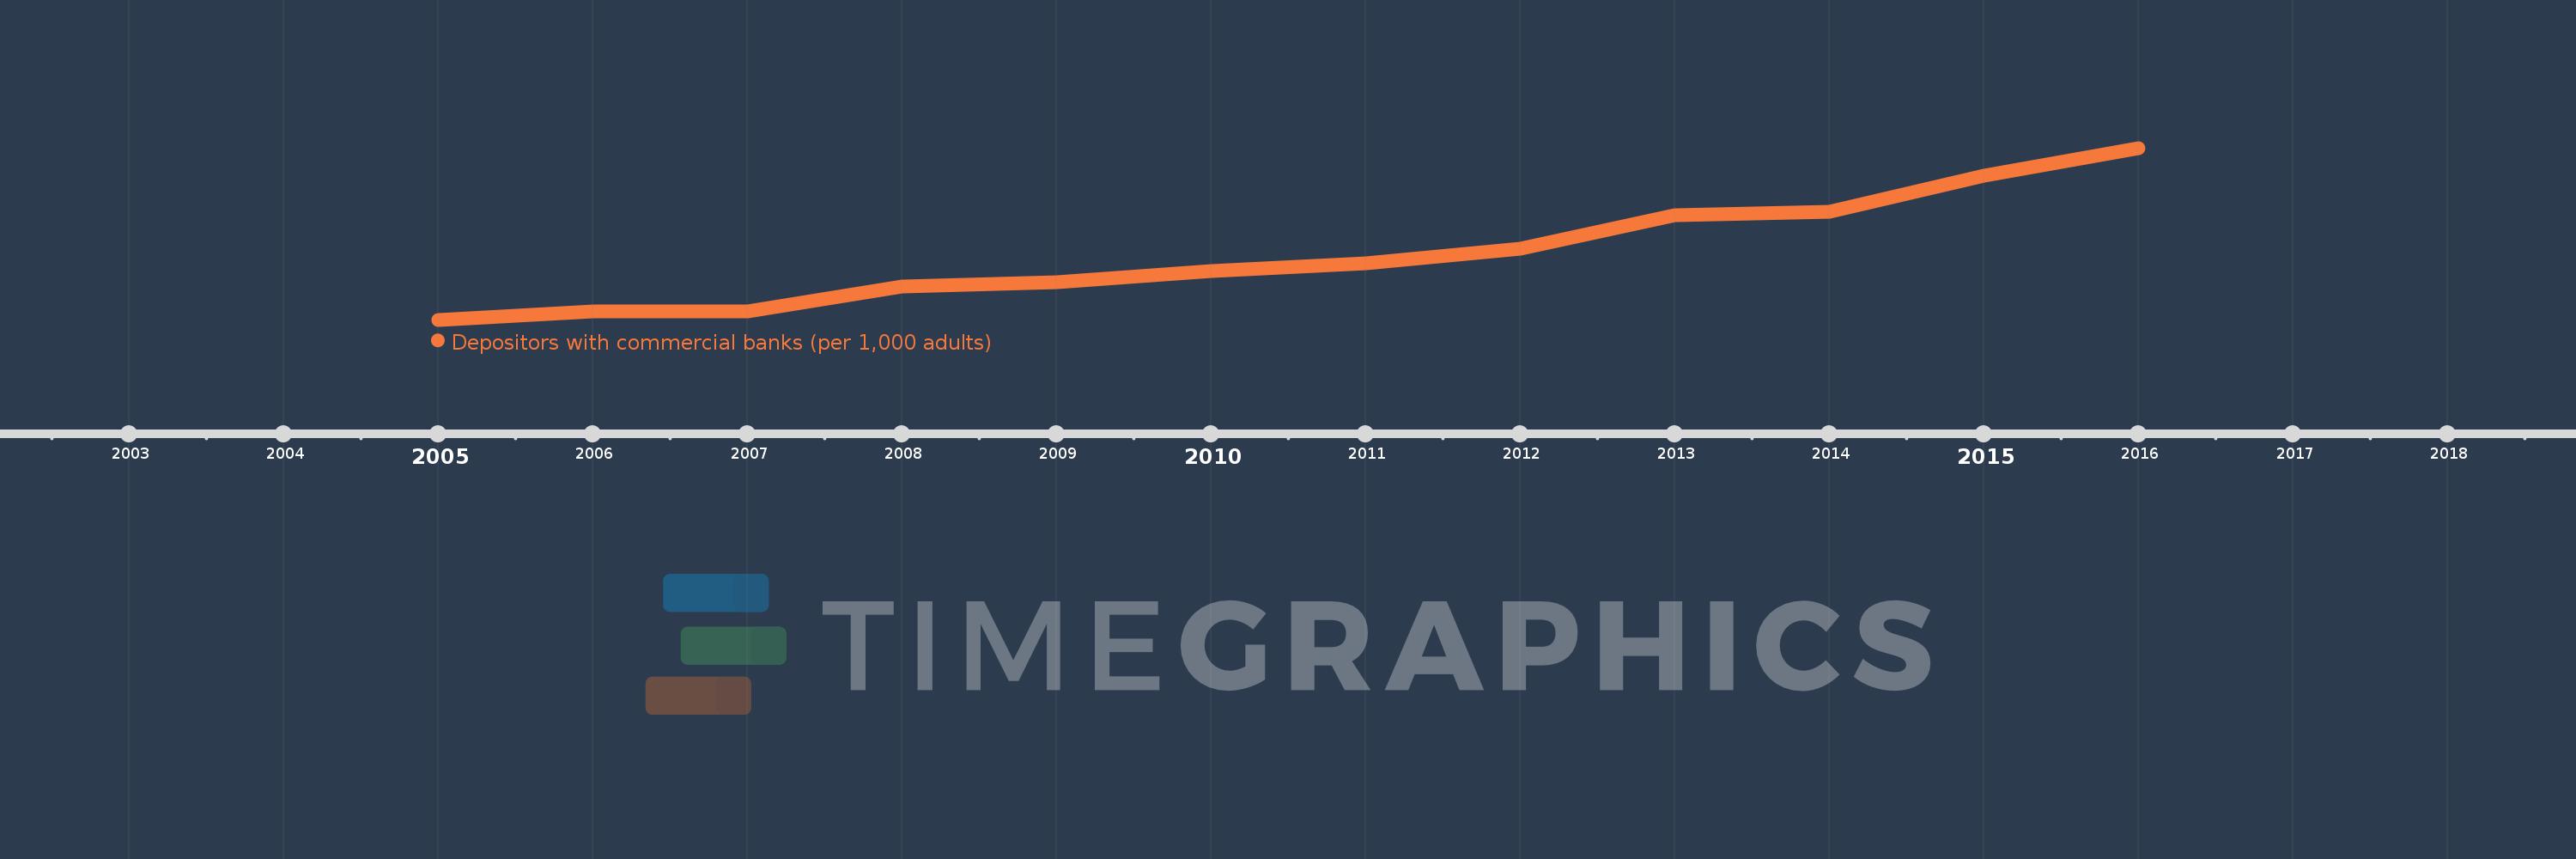
Depositors with commercial banks (per 1,000 adults)
2016,2015,2014,2013,2012,2011,2010,2009,2008,2007,2006,2005
Estas estadísticas en otros países:
línea de tiempo (timeline):
En esta escala de tiempo se presenta un gráfico de 2005 y 2016 de Congo, Rep.. Los datos de 2004 están ausentes. El número de observaciones reales por fecha: 12.
Fuente (nombre):
Indicadores del desarrollo mundial
Fuente (organización):
International Monetary Fund, Financial Access Survey.
Categorías:
Financial Sector
Se ha actualizado:
23 abr 2017 año
Los indicadores de los cambios de valor en los últimos años
Mínimo:
15.015
1 ene 2005 año
Máximo:
145.551
1 ene 2016 año
A la fecha de observación
Valor
Cambio absoluto
El cambio con respecto al valor anterior
1 ene 2005 año
15.015
+15.015
0.0%
1 ene 2006 año
21.376
+6.361
42.37%
1 ene 2007 año
21.564
+0.187
0.88%
1 ene 2008 año
40.51
+18.946
87.86%
1 ene 2009 año
43.78
+3.27
8.07%
1 ene 2010 año
51.826
+8.046
18.38%
1 ene 2011 año
58.022
+6.196
11.96%
1 ene 2012 año
69.088
+11.065
19.07%
1 ene 2013 año
94.264
+25.176
36.44%
1 ene 2014 año
97.34
+3.076
3.26%
1 ene 2015 año
124.299
+26.959
27.7%
1 ene 2016 año
145.551
+21.252
17.1%
Ranking de los países por los datos estadísticos actuales


Comentarios: