29
/es/
es
AIzaSyAYiBZKx7MnpbEhh9jyipgxe19OcubqV5w
April 1, 2024
109719
Congo, Dem. Rep.
COD
true
2
1
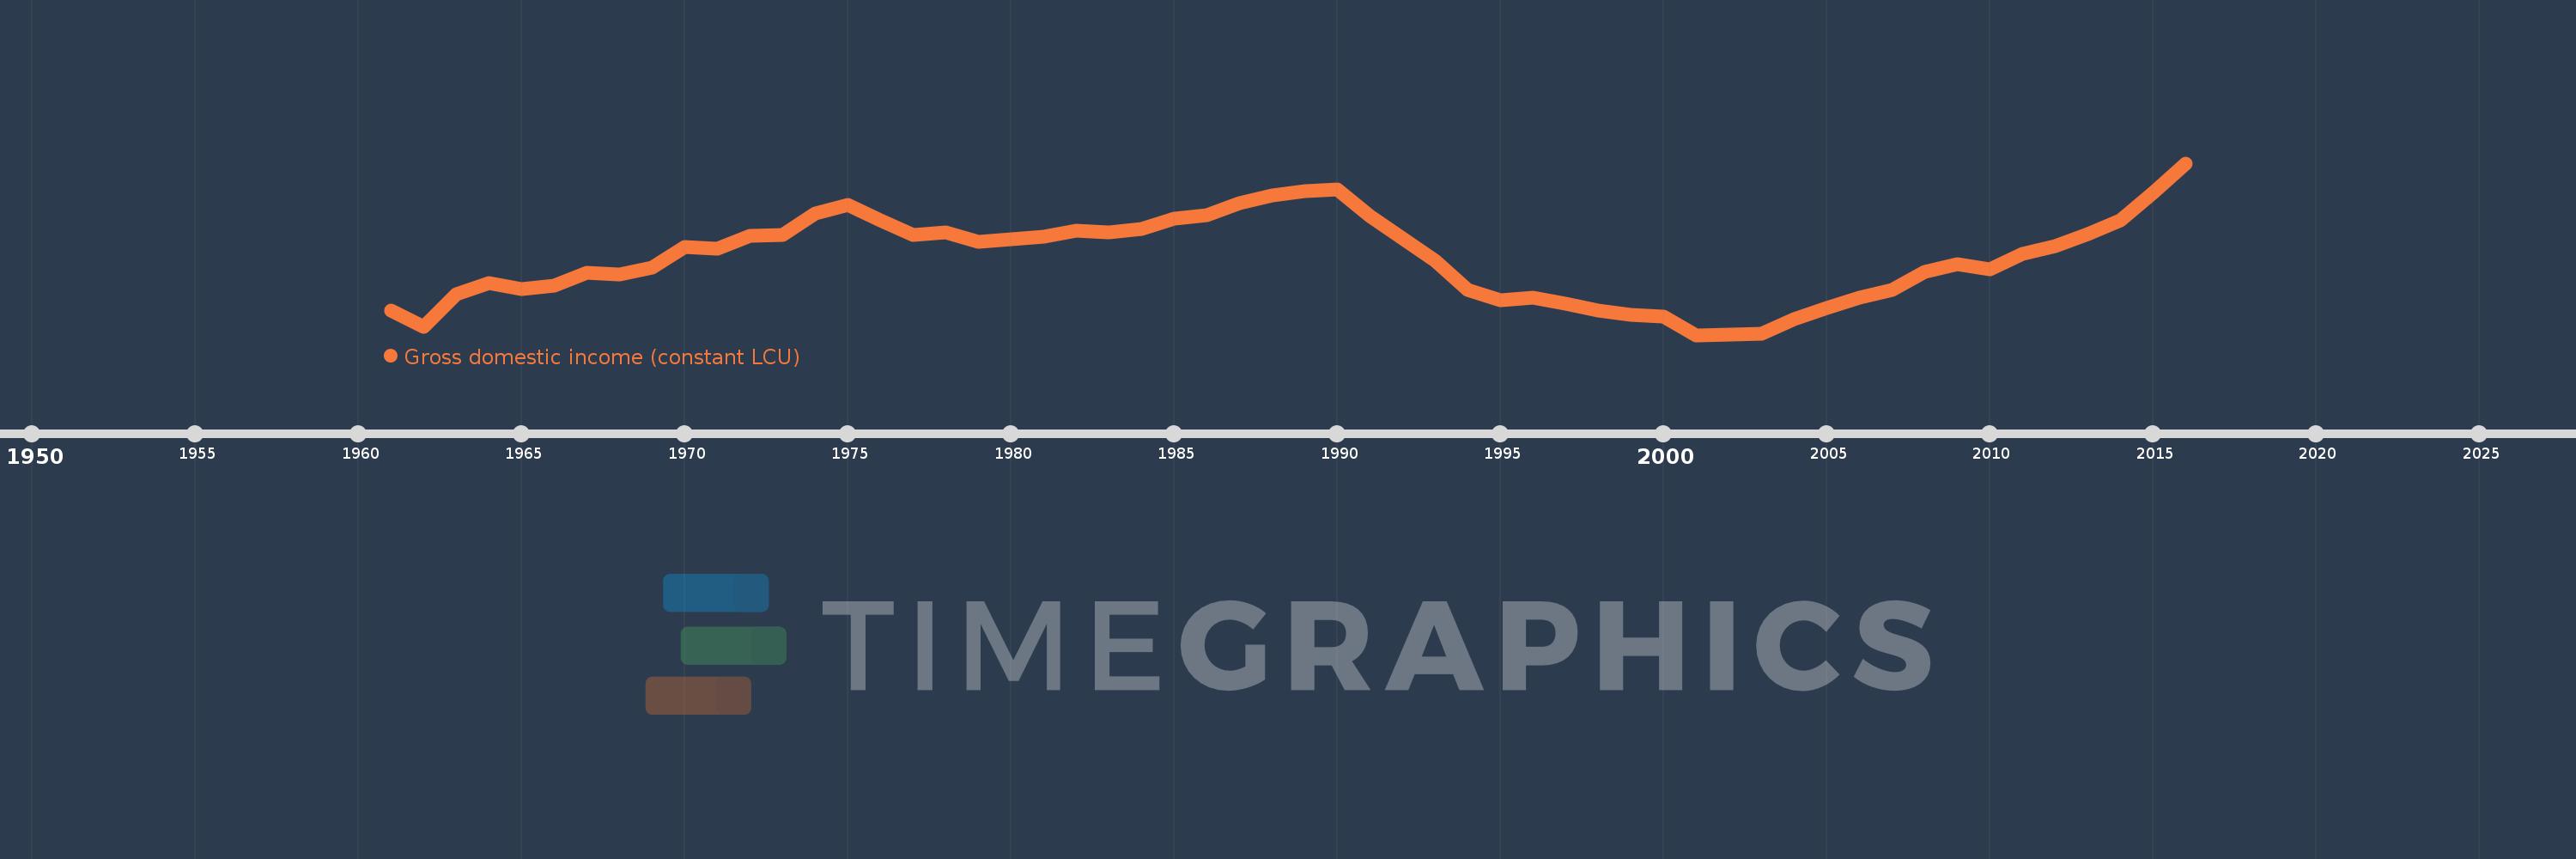
Gross domestic income (constant LCU)
2016,2015,2014,2013,2012,2011,2010,2009,2008,2007,2006,2005,2004,2003,2002,2001,2000,1999,1998,1997,1996,1995,1994,1993,1992,1991,1990,1989,1988,1987,1986,1985,1984,1983,1982,1981,1980,1979,1978,1977,1976,1975,1974,1973,1972,1971,1970,1969,1968,1967,1966,1965,1964,1963,1962,1961
Estas estadísticas en otros países:
AlbaniaAlgeriaAngolaAntigua and BarbudaArgentinaArmeniaAustraliaAustriaAzerbaijanBahamas, TheBahrainBangladeshBarbadosBelarusBelgiumBelizeBeninBhutanBoliviaBosnia and HerzegovinaBotswanaBrazilBrunei DarussalamBulgariaBurkina FasoBurundiCabo VerdeCambodiaCameroonCanadaChadChileColombiaComorosCongo, Dem. Rep.Congo, Rep.Costa RicaCote d'IvoireCroatiaCubaCyprusCzech RepublicDenmarkDjiboutiDominican RepublicEcuadorEgypt, Arab Rep.El SalvadorEquatorial GuineaEritreaEstoniaEthiopiaFijiFinlandFranceGabonGambia, TheGeorgiaGermanyGhanaGreeceGuatemalaGuineaGuinea-BissauHaitiHondurasHong Kong SAR, ChinaHungaryIcelandIndiaIndonesiaIran, Islamic Rep.IrelandIsraelItalyJamaicaJapanJordanKazakhstanKenyaKorea, Rep.KosovoKuwaitKyrgyz RepublicLao PDRLatviaLebanonLiberiaLibyaLithuaniaLuxembourgMacao SAR, ChinaMacedonia, FYRMadagascarMalawiMalaysiaMaliMaltaMauritaniaMauritiusMexicoMoldovaMongoliaMontenegroMoroccoMozambiqueMyanmarNamibiaNepalNetherlandsNew ZealandNicaraguaNigerNigeriaNorwayOmanPakistanPanamaPapua New GuineaParaguayPeruPhilippinesPolandPortugalPuerto RicoQatarRomaniaRussian FederationRwandaSamoaSaudi ArabiaSenegalSerbiaSeychellesSierra LeoneSingaporeSlovak RepublicSloveniaSomaliaSouth AfricaSouth SudanSpainSri LankaSudanSurinameSwazilandSwedenSwitzerlandSyrian Arab RepublicTajikistanTanzaniaThailandTimor-LesteTogoTrinidad and TobagoTunisiaTurkeyTurkmenistanUgandaUkraineUnited Arab EmiratesUnited KingdomUnited StatesUruguayUzbekistanVanuatuVenezuela, RBVietnamWest Bank and GazaZambiaZimbabwe línea de tiempo (timeline):
En esta escala de tiempo se presenta un gráfico de 1961 y 2016 de Congo, Dem. Rep.. Los datos de 1960 están ausentes. El número de observaciones reales por fecha: 56.
Fuente (nombre):
Indicadores del desarrollo mundial
Fuente (organización):
World Bank national accounts data, and OECD National Accounts data files.
Categorías:
Economy & Growth
Se ha actualizado:
23 abr 2017 año
Los indicadores de los cambios de valor en los últimos años
En promedio:
6.899 billones
Mínimo:
4.482 billones
1 ene 2001 año
Máximo:
9.918 billones
1 ene 2016 año
A la fecha de observación
Valor
Cambio absoluto
El cambio con respecto al valor anterior
1 ene 1961 año
5.268 billones
+5.268 billones
0.0%
1 ene 1962 año
4.732 billones
-536.016 bn
-10.17%
1 ene 1963 año
5.774 billones
+1.042 billones
22.03%
1 ene 1964 año
6.114 billones
+339.623 bn
5.88%
1 ene 1965 año
5.938 billones
-176.096 bn
-2.88%
1 ene 1966 año
6.042 billones
+104.356 bn
1.76%
1 ene 1967 año
6.456 billones
+413.556 bn
6.84%
1 ene 1968 año
6.388 billones
-67.737 bn
-1.05%
1 ene 1969 año
6.615 billones
+227.147 bn
3.56%
1 ene 1970 año
7.265 billones
+649.724 bn
9.82%
1 ene 1971 año
7.224 billones
-40.821 bn
-0.56%
1 ene 1972 año
7.609 billones
+384.887 bn
5.33%
1 ene 1973 año
7.642 billones
+32.764 bn
0.43%
1 ene 1974 año
8.335 billones
+692.992 bn
9.07%
1 ene 1975 año
8.602 billones
+266.693 bn
3.2%
1 ene 1976 año
8.105 billones
-496.62 bn
-5.77%
1 ene 1977 año
7.64 billones
-464.551 bn
-5.73%
1 ene 1978 año
7.735 billones
+94.871 bn
1.24%
1 ene 1979 año
7.419 billones
-316.764 bn
-4.1%
1 ene 1980 año
7.505 billones
+86.064 bn
1.16%
1 ene 1981 año
7.592 billones
+87.048 bn
1.16%
1 ene 1982 año
7.776 billones
+184.175 bn
2.43%
1 ene 1983 año
7.741 billones
-34.58 bn
-0.44%
1 ene 1984 año
7.836 billones
+94.528 bn
1.22%
1 ene 1985 año
8.174 billones
+337.967 bn
4.31%
1 ene 1986 año
8.262 billones
+88.665 bn
1.08%
1 ene 1987 año
8.667 billones
+404.203 bn
4.89%
1 ene 1988 año
8.891 billones
+224.903 bn
2.6%
1 ene 1989 año
9.039 billones
+147.132 bn
1.65%
1 ene 1990 año
9.084 billones
+44.916 bn
0.5%
1 ene 1991 año
8.252 billones
-831.477 bn
-9.15%
1 ene 1992 año
7.531 billones
-721.252 bn
-8.74%
1 ene 1993 año
6.846 billones
-685.187 bn
-9.1%
1 ene 1994 año
5.898 billones
-947.489 bn
-13.84%
1 ene 1995 año
5.589 billones
-309.48 bn
-5.25%
1 ene 1996 año
5.659 billones
+70.802 bn
1.27%
1 ene 1997 año
5.464 billones
-195.22 bn
-3.45%
1 ene 1998 año
5.244 billones
-220.501 bn
-4.04%
1 ene 1999 año
5.119 billones
-124.64 bn
-2.38%
1 ene 2000 año
5.08 billones
-39.228 bn
-0.77%
1 ene 2001 año
4.482 billones
-597.636 bn
-11.76%
1 ene 2002 año
4.496 billones
+13.736 bn
0.31%
1 ene 2003 año
4.516 billones
+19.851 bn
0.44%
1 ene 2004 año
4.985 billones
+468.967 bn
10.39%
1 ene 2005 año
5.343 billones
+357.876 bn
7.18%
1 ene 2006 año
5.67 billones
+327.415 bn
6.13%
1 ene 2007 año
5.915 billones
+245.033 bn
4.32%
1 ene 2008 año
6.487 billones
+572.158 bn
9.67%
1 ene 2009 año
6.728 billones
+241.138 bn
3.72%
1 ene 2010 año
6.563 billones
-165.069 bn
-2.45%
1 ene 2011 año
7.053 billones
+489.773 bn
7.46%
1 ene 2012 año
7.282 billones
+228.542 bn
3.24%
1 ene 2013 año
7.663 billones
+380.98 bn
5.23%
1 ene 2014 año
8.103 billones
+440.778 bn
5.75%
1 ene 2015 año
8.984 billones
+880.832 bn
10.87%
1 ene 2016 año
9.918 billones
+933.503 bn
10.39%
Ranking de los países por los datos estadísticos actuales


Comentarios: