29
/es/
es
AIzaSyAYiBZKx7MnpbEhh9jyipgxe19OcubqV5w
April 1, 2024
101388
Canada
CAN
true
2
1
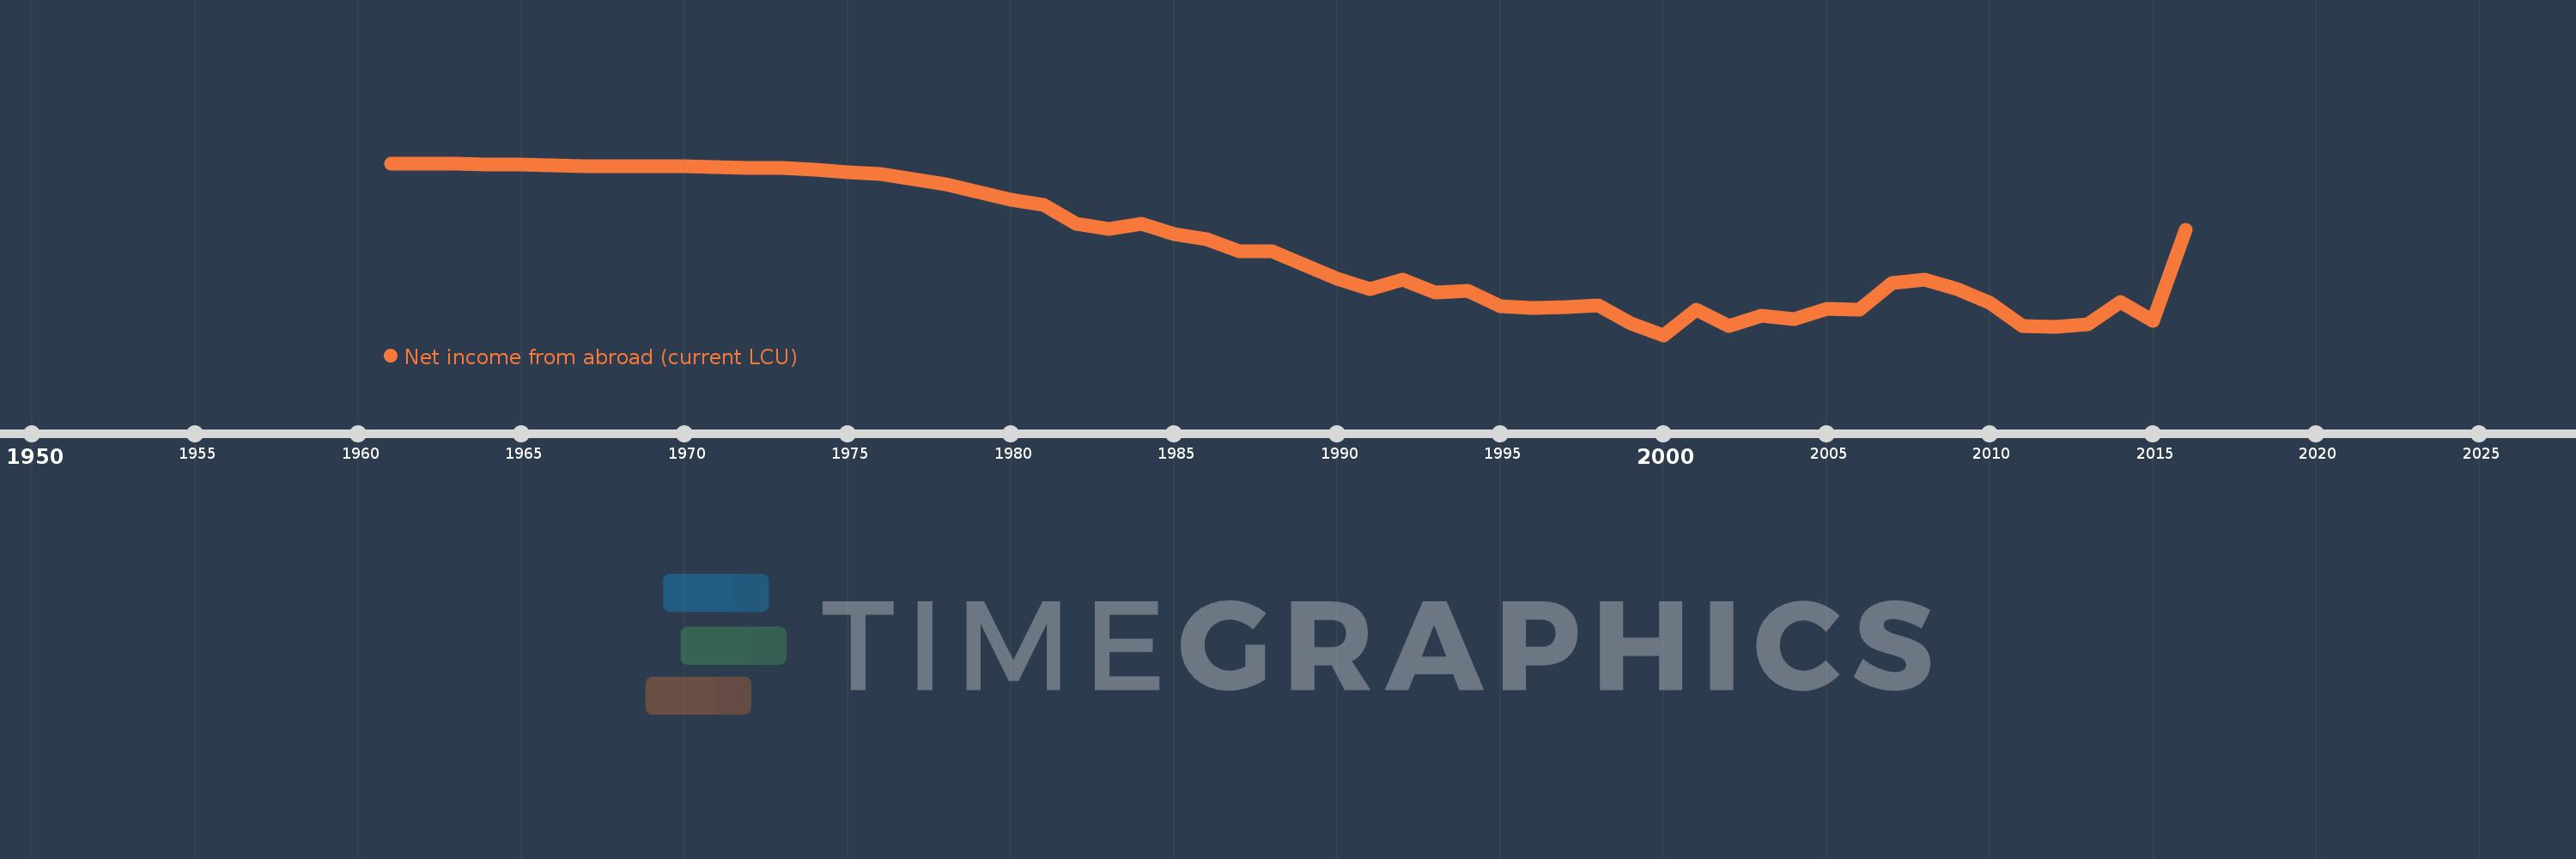
Net income from abroad (current LCU)
2016,2015,2014,2013,2012,2011,2010,2009,2008,2007,2006,2005,2004,2003,2002,2001,2000,1999,1998,1997,1996,1995,1994,1993,1992,1991,1990,1989,1988,1987,1986,1985,1984,1983,1982,1981,1980,1979,1978,1977,1976,1975,1974,1973,1972,1971,1970,1969,1968,1967,1966,1965,1964,1963,1962,1961
Estas estadísticas en otros países:
AfghanistanAlbaniaAlgeriaAndorraAngolaAntigua and BarbudaArgentinaArmeniaAustraliaAustriaAzerbaijanBahamas, TheBahrainBangladeshBarbadosBelarusBelgiumBelizeBeninBermudaBhutanBoliviaBosnia and HerzegovinaBotswanaBrazilBrunei DarussalamBulgariaBurkina FasoBurundiCabo VerdeCambodiaCameroonCanadaCentral African RepublicChadChannel IslandsChileChinaColombiaComorosCongo, Dem. Rep.Congo, Rep.Costa RicaCote d'IvoireCroatiaCubaCyprusCzech RepublicDenmarkDjiboutiDominicaDominican RepublicEcuadorEgypt, Arab Rep.El SalvadorEquatorial GuineaEritreaEstoniaEthiopiaFaroe IslandsFijiFinlandFranceFrench PolynesiaGabonGambia, TheGeorgiaGermanyGhanaGreeceGreenlandGrenadaGuatemalaGuineaGuinea-BissauGuyanaHaitiHondurasHong Kong SAR, ChinaHungaryIcelandIndiaIndonesiaIran, Islamic Rep.IraqIrelandIsraelItalyJamaicaJapanJordanKazakhstanKenyaKiribatiKorea, Rep.KosovoKuwaitKyrgyz RepublicLao PDRLatviaLebanonLesothoLiberiaLibyaLithuaniaLuxembourgMacao SAR, ChinaMacedonia, FYRMadagascarMalawiMalaysiaMaldivesMaliMaltaMarshall IslandsMauritaniaMauritiusMexicoMicronesia, Fed. Sts.MoldovaMonacoMongoliaMontenegroMoroccoMozambiqueMyanmarNamibiaNepalNetherlandsNew CaledoniaNew ZealandNicaraguaNigerNigeriaNorwayOmanPakistanPalauPanamaPapua New GuineaParaguayPeruPhilippinesPolandPortugalPuerto RicoQatarRomaniaRussian FederationRwandaSamoaSao Tome and PrincipeSaudi ArabiaSenegalSerbiaSeychellesSierra LeoneSingaporeSlovak RepublicSloveniaSolomon IslandsSomaliaSouth AfricaSouth SudanSpainSri LankaSt. Kitts and NevisSt. LuciaSt. Vincent and the GrenadinesSudanSurinameSwazilandSwedenSwitzerlandSyrian Arab RepublicTajikistanTanzaniaThailandTimor-LesteTogoTongaTrinidad and TobagoTunisiaTurkeyTurkmenistanTuvaluUgandaUkraineUnited Arab EmiratesUnited KingdomUnited StatesUruguayUzbekistanVanuatuVenezuela, RBVietnamVirgin Islands (U.S.)West Bank and GazaYemen, Rep.ZambiaZimbabwe línea de tiempo (timeline):
En esta escala de tiempo se presenta un gráfico de 1961 y 2016 de Canada. Los datos de 1960 están ausentes. El número de observaciones reales por fecha: 56.
Fuente (nombre):
Indicadores del desarrollo mundial
Fuente (organización):
World Bank national accounts data, and OECD National Accounts data files.
Categorías:
Economy & Growth
Se ha actualizado:
23 abr 2017 año
Los indicadores de los cambios de valor en los últimos años
Mínimo:
-33.919 bn
1 ene 2000 año
Máximo:
-612.643 millones
1 ene 1961 año
A la fecha de observación
Valor
Cambio absoluto
El cambio con respecto al valor anterior
1 ene 1961 año
-612.643 millones
-612.643 millones
0.0%
1 ene 1962 año
-719.958 millones
-107.315 millones
17.52%
1 ene 1963 año
-768.549 millones
-48.591 millones
6.75%
1 ene 1964 año
-845.718 millones
-77.169 millones
10.04%
1 ene 1965 año
-905.155 millones
-59.437 millones
7.03%
1 ene 1966 año
-988.709 millones
-83.554 millones
9.23%
1 ene 1967 año
-1.114 bn
-125.583 millones
12.7%
1 ene 1968 año
-1.236 bn
-122.126 millones
10.96%
1 ene 1969 año
-1.211 bn
+25.092 millones
-2.03%
1 ene 1970 año
-1.156 bn
+55.804 millones
-4.61%
1 ene 1971 año
-1.358 bn
-202.327 millones
17.51%
1 ene 1972 año
-1.476 bn
-118.485 millones
8.73%
1 ene 1973 año
-1.493 bn
-16.447 millones
1.11%
1 ene 1974 año
-1.833 bn
-339.852 millones
22.77%
1 ene 1975 año
-2.331 bn
-498.543 millones
27.2%
1 ene 1976 año
-2.684 bn
-352.559 millones
15.12%
1 ene 1977 año
-3.666 bn
-982.175 millones
36.6%
1 ene 1978 año
-4.755 bn
-1.089 bn
29.71%
1 ene 1979 año
-6.18 bn
-1.425 bn
29.97%
1 ene 1980 año
-7.739 bn
-1.559 bn
25.23%
1 ene 1981 año
-8.667 bn
-928.265 millones
11.99%
1 ene 1982 año
-12.3 bn
-3.633 bn
41.91%
1 ene 1983 año
-13.407 bn
-1.107 bn
9.0%
1 ene 1984 año
-12.346 bn
+1.061 bn
-7.91%
1 ene 1985 año
-14.297 bn
-1.951 bn
15.8%
1 ene 1986 año
-15.282 bn
-985.0 millones
6.89%
1 ene 1987 año
-17.723 bn
-2.441 bn
15.97%
1 ene 1988 año
-17.705 bn
+18.0 millones
-0.1%
1 ene 1989 año
-20.295 bn
-2.59 bn
14.63%
1 ene 1990 año
-23.091 bn
-2.796 bn
13.78%
1 ene 1991 año
-25.026 bn
-1.935 bn
8.38%
1 ene 1992 año
-23.257 bn
+1.769 bn
-7.07%
1 ene 1993 año
-25.754 bn
-2.497 bn
10.74%
1 ene 1994 año
-25.391 bn
+363.0 millones
-1.41%
1 ene 1995 año
-28.366 bn
-2.975 bn
11.72%
1 ene 1996 año
-28.648 bn
-282.0 millones
0.99%
1 ene 1997 año
-28.568 bn
+80.0 millones
-0.28%
1 ene 1998 año
-28.133 bn
+435.0 millones
-1.52%
1 ene 1999 año
-31.646 bn
-3.513 bn
12.49%
1 ene 2000 año
-33.919 bn
-2.273 bn
7.18%
1 ene 2001 año
-29.021 bn
+4.898 bn
-14.44%
1 ene 2002 año
-32.229 bn
-3.208 bn
11.05%
1 ene 2003 año
-30.206 bn
+2.023 bn
-6.28%
1 ene 2004 año
-30.86 bn
-654.0 millones
2.17%
1 ene 2005 año
-28.787 bn
+2.073 bn
-6.72%
1 ene 2006 año
-29.022 bn
-235.0 millones
0.82%
1 ene 2007 año
-23.767 bn
+5.255 bn
-18.11%
1 ene 2008 año
-23.118 bn
+649.0 millones
-2.73%
1 ene 2009 año
-25.055 bn
-1.937 bn
8.38%
1 ene 2010 año
-27.645 bn
-2.59 bn
10.34%
1 ene 2011 año
-32.253 bn
-4.608 bn
16.67%
1 ene 2012 año
-32.354 bn
-101.0 millones
0.31%
1 ene 2013 año
-31.873 bn
+481.0 millones
-1.49%
1 ene 2014 año
-27.444 bn
+4.429 bn
-13.9%
1 ene 2015 año
-31.198 bn
-3.754 bn
13.68%
1 ene 2016 año
-13.534 bn
+17.664 bn
-56.62%
Ranking de los países por los datos estadísticos actuales


Comentarios: