29
/de/
de
AIzaSyAYiBZKx7MnpbEhh9jyipgxe19OcubqV5w
April 1, 2024
90200
Botswana
BWA
true
2
1
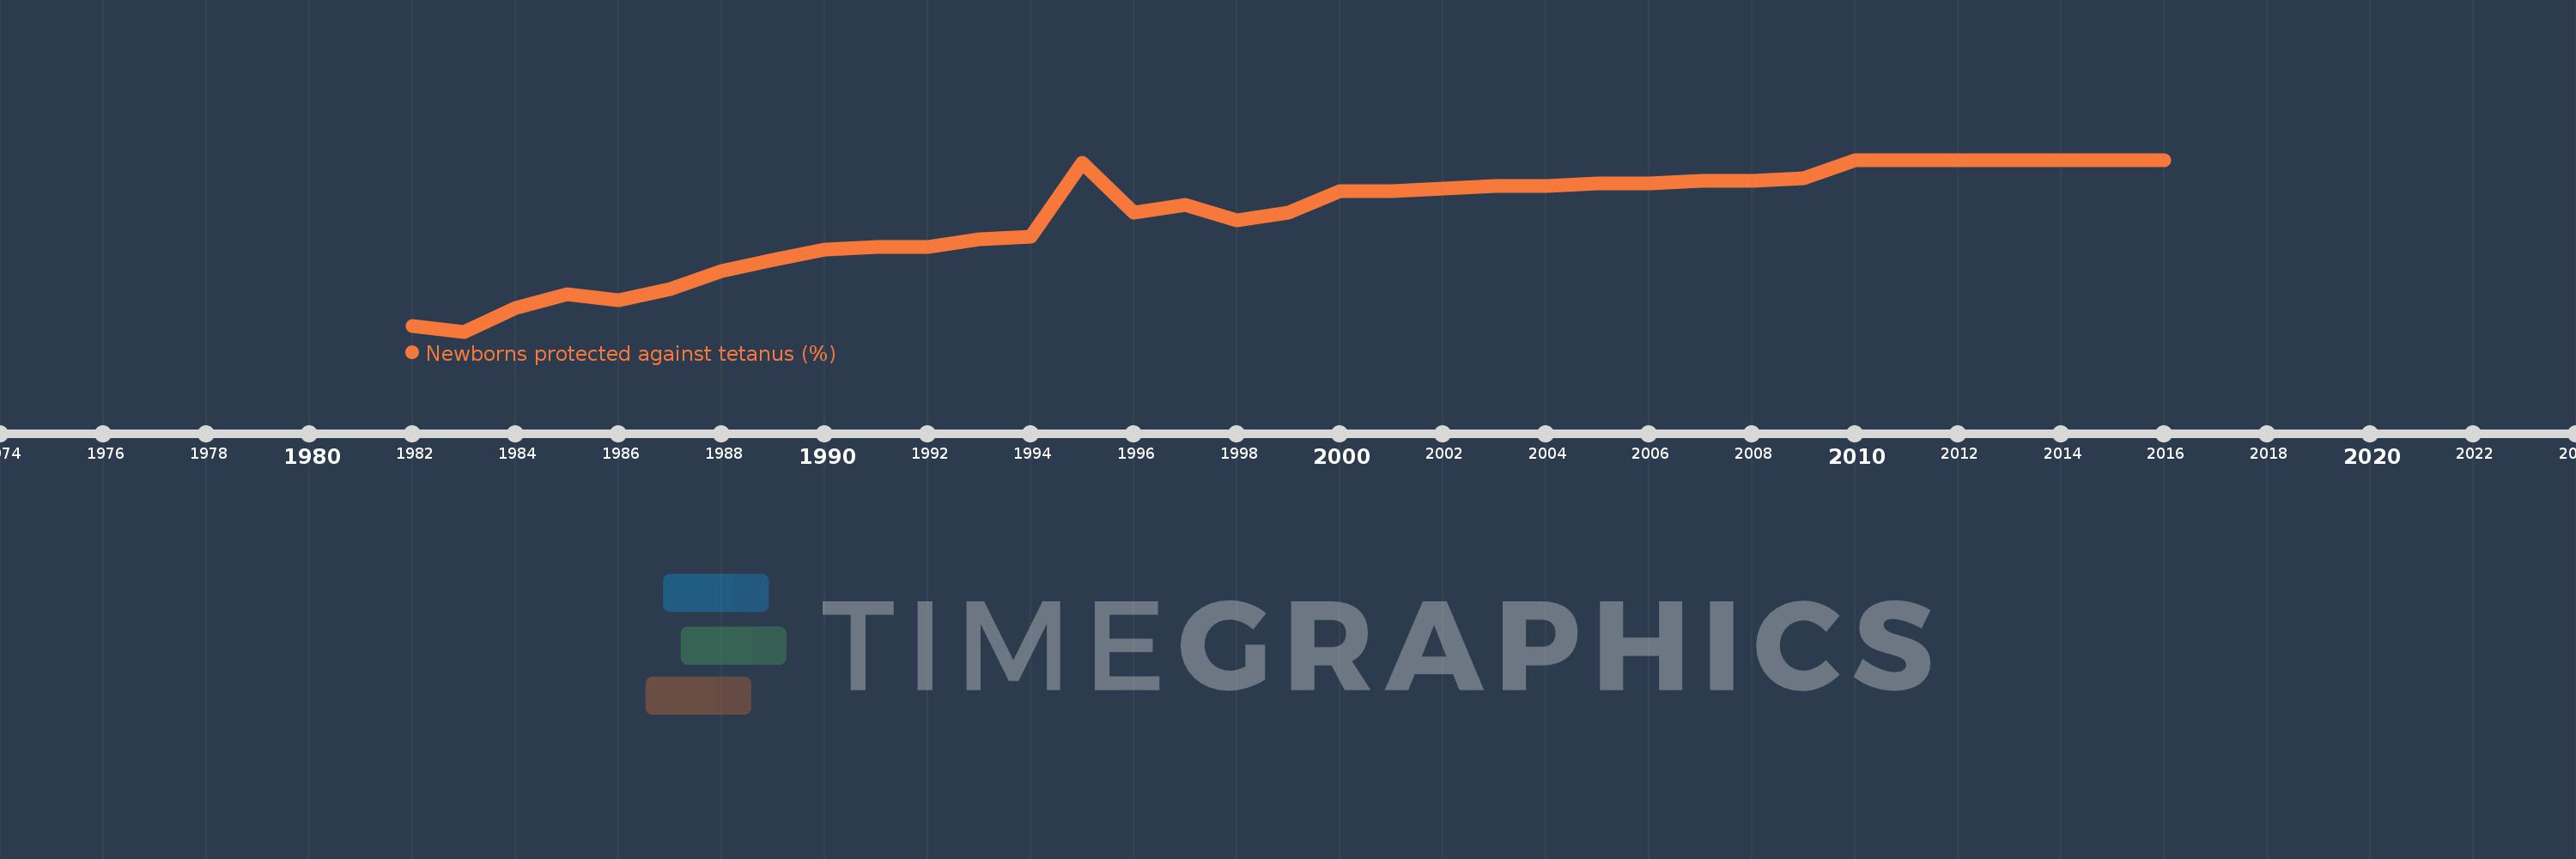
Newborns protected against tetanus (%)
2016,2015,2014,2013,2012,2011,2010,2009,2008,2007,2006,2005,2004,2003,2002,2001,2000,1999,1998,1997,1996,1995,1994,1993,1992,1991,1990,1989,1988,1987,1986,1985,1984,1983,1982
Diese Statistik in anderen Ländern:
Zeitlinie:
Diese Zeitleiste vorliegt die Graphik ab 1982 J. bis 2016 J. Botswana. Die Angaben bis 1981 J. sind nicht vorhanden. Die Zahl aktueller Beobachtungen nach Daten: 35.
Die Quelle (Bezeichnung):
Kennzahlen der Weltentwicklung
Die Quelle (Einrichtung):
WHO and UNICEF (http://www.who.int/immunization/monitoring_surveillance/en/).
Kategorien:
Health
Es wurde aktualisiert:
23 Apr 2017 Jahr
Kennzahlen der Wertänderungen vom Jahr zum Jahr
Minimum:
27.0
1 Jan 1983 Jahr
Maximum:
92.0
1 Jan 2010 Jahr
Zum Datum der Beobachtung
Wert
Absolute Veränderung
Die Veränderung bezüglich dem vorherigen Wert
1 Jan 1982 Jahr
29.0
+29.0
0.0%
1 Jan 1983 Jahr
27.0
-2.0
-6.9%
1 Jan 1984 Jahr
36.0
+9.0
33.33%
1 Jan 1985 Jahr
41.0
+5.0
13.89%
1 Jan 1986 Jahr
39.0
-2.0
-4.88%
1 Jan 1987 Jahr
43.0
+4.0
10.26%
1 Jan 1988 Jahr
50.0
+7.0
16.28%
1 Jan 1989 Jahr
54.0
+4.0
8.0%
1 Jan 1990 Jahr
58.0
+4.0
7.41%
1 Jan 1991 Jahr
59.0
+1.0
1.72%
1 Jan 1992 Jahr
59.0
0.0
0.0%
1 Jan 1993 Jahr
62.0
+3.0
5.08%
1 Jan 1994 Jahr
63.0
+1.0
1.61%
1 Jan 1995 Jahr
91.0
+28.0
44.44%
1 Jan 1996 Jahr
72.0
-19.0
-20.88%
1 Jan 1997 Jahr
75.0
+3.0
4.17%
1 Jan 1998 Jahr
69.0
-6.0
-8.0%
1 Jan 1999 Jahr
72.0
+3.0
4.35%
1 Jan 2000 Jahr
80.0
+8.0
11.11%
1 Jan 2001 Jahr
80.0
0.0
0.0%
1 Jan 2002 Jahr
81.0
+1.0
1.25%
1 Jan 2003 Jahr
82.0
+1.0
1.23%
1 Jan 2004 Jahr
82.0
0.0
0.0%
1 Jan 2005 Jahr
83.0
+1.0
1.22%
1 Jan 2006 Jahr
83.0
0.0
0.0%
1 Jan 2007 Jahr
84.0
+1.0
1.2%
1 Jan 2008 Jahr
84.0
0.0
0.0%
1 Jan 2009 Jahr
85.0
+1.0
1.19%
1 Jan 2010 Jahr
92.0
+7.0
8.24%
1 Jan 2011 Jahr
92.0
0.0
0.0%
1 Jan 2012 Jahr
92.0
0.0
0.0%
1 Jan 2013 Jahr
92.0
0.0
0.0%
1 Jan 2014 Jahr
92.0
0.0
0.0%
1 Jan 2015 Jahr
92.0
0.0
0.0%
1 Jan 2016 Jahr
92.0
0.0
0.0%
Bewertung der Länder gemäß mit laufender Statistik nach Jahren


Kommentare: