29
/de/
de
AIzaSyAYiBZKx7MnpbEhh9jyipgxe19OcubqV5w
April 1, 2024
88886
Bosnia and Herzegovina
BIH
true
2
1
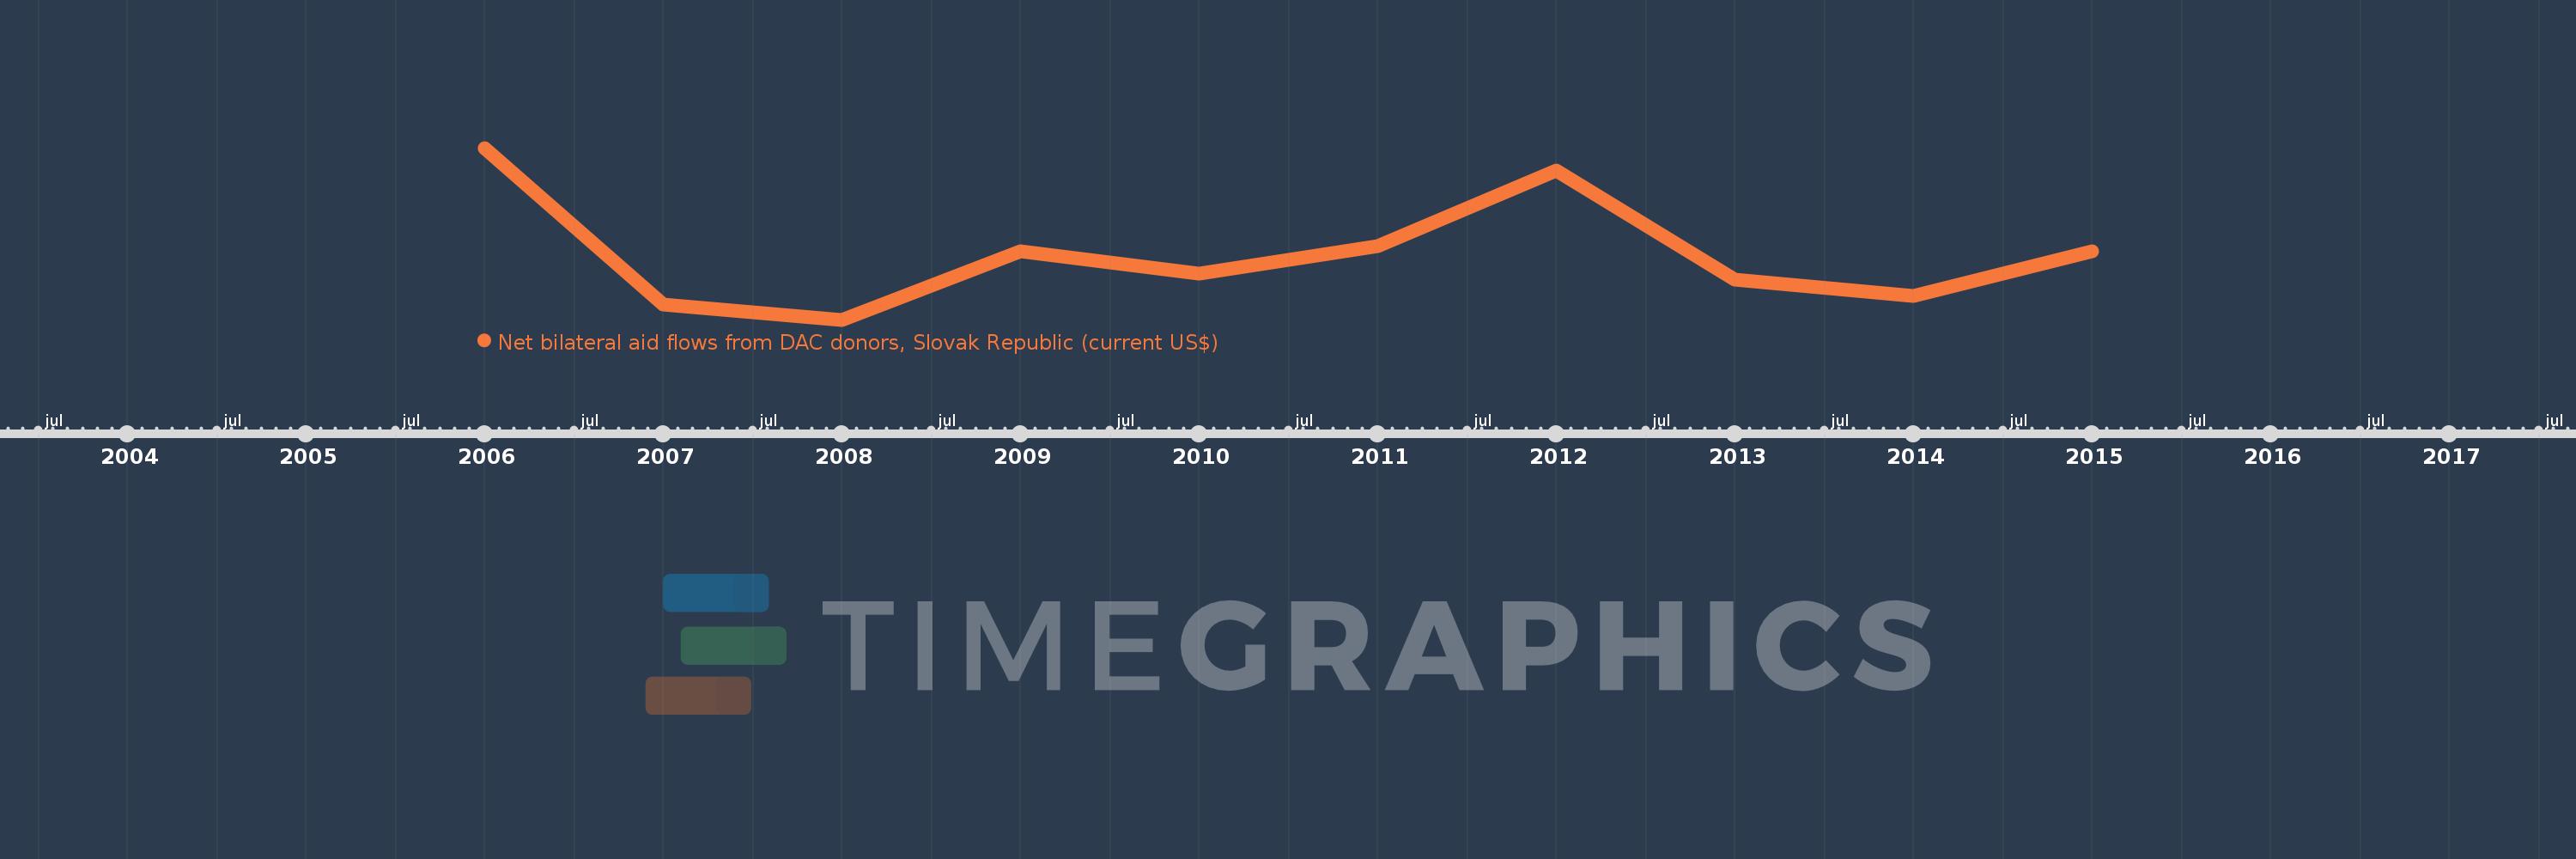
Net bilateral aid flows from DAC donors, Slovak Republic (current US$)
2015,2014,2013,2012,2011,2010,2009,2008,2007,2006
Diese Statistik in anderen Ländern:
Zeitlinie:
Diese Zeitleiste vorliegt die Graphik ab 2006 J. bis 2015 J. Bosnia and Herzegovina. Die Angaben bis 2005 J. sind nicht vorhanden. Die Zahl aktueller Beobachtungen nach Daten: 10.
Die Quelle (Bezeichnung):
Kennzahlen der Weltentwicklung
Die Quelle (Einrichtung):
Development Assistance Committee of the Organisation for Economic Co-operation and Development, Geographical Distribution of Financial Flows to Developing Countries, Development Co-operation Report, and International Development Statistics database. Data are available online at: www.oecd.org/dac/stats/idsonline.
Kategorien:
Aid Effectiveness
Es wurde aktualisiert:
23 Apr 2017 Jahr
Kennzahlen der Wertänderungen vom Jahr zum Jahr
im Durchschnitt:
537.0 Tsnd.
Minimum:
10.0 Tsnd.
1 Jan 2008 Jahr
Maximum:
1.39 Mln.
1 Jan 2006 Jahr
Zum Datum der Beobachtung
Wert
Absolute Veränderung
Die Veränderung bezüglich dem vorherigen Wert
1 Jan 2006 Jahr
1.39 Mln.
+1.39 Mln.
0.0%
1 Jan 2007 Jahr
130.0 Tsnd.
-1.26 Mln.
-90.65%
1 Jan 2008 Jahr
10.0 Tsnd.
-120.0 Tsnd.
-92.31%
1 Jan 2009 Jahr
560.0 Tsnd.
+550.0 Tsnd.
5.5 Tsnd.%
1 Jan 2010 Jahr
380.0 Tsnd.
-180.0 Tsnd.
-32.14%
1 Jan 2011 Jahr
600.0 Tsnd.
+220.0 Tsnd.
57.89%
1 Jan 2012 Jahr
1.21 Mln.
+610.0 Tsnd.
101.67%
1 Jan 2013 Jahr
330.0 Tsnd.
-880.0 Tsnd.
-72.73%
1 Jan 2014 Jahr
200.0 Tsnd.
-130.0 Tsnd.
-39.39%
1 Jan 2015 Jahr
560.0 Tsnd.
+360.0 Tsnd.
180.0%
Bewertung der Länder gemäß mit laufender Statistik nach Jahren


Kommentare: