29
/de/
de
AIzaSyAYiBZKx7MnpbEhh9jyipgxe19OcubqV5w
April 1, 2024
79593
Barbados
BRB
true
2
1
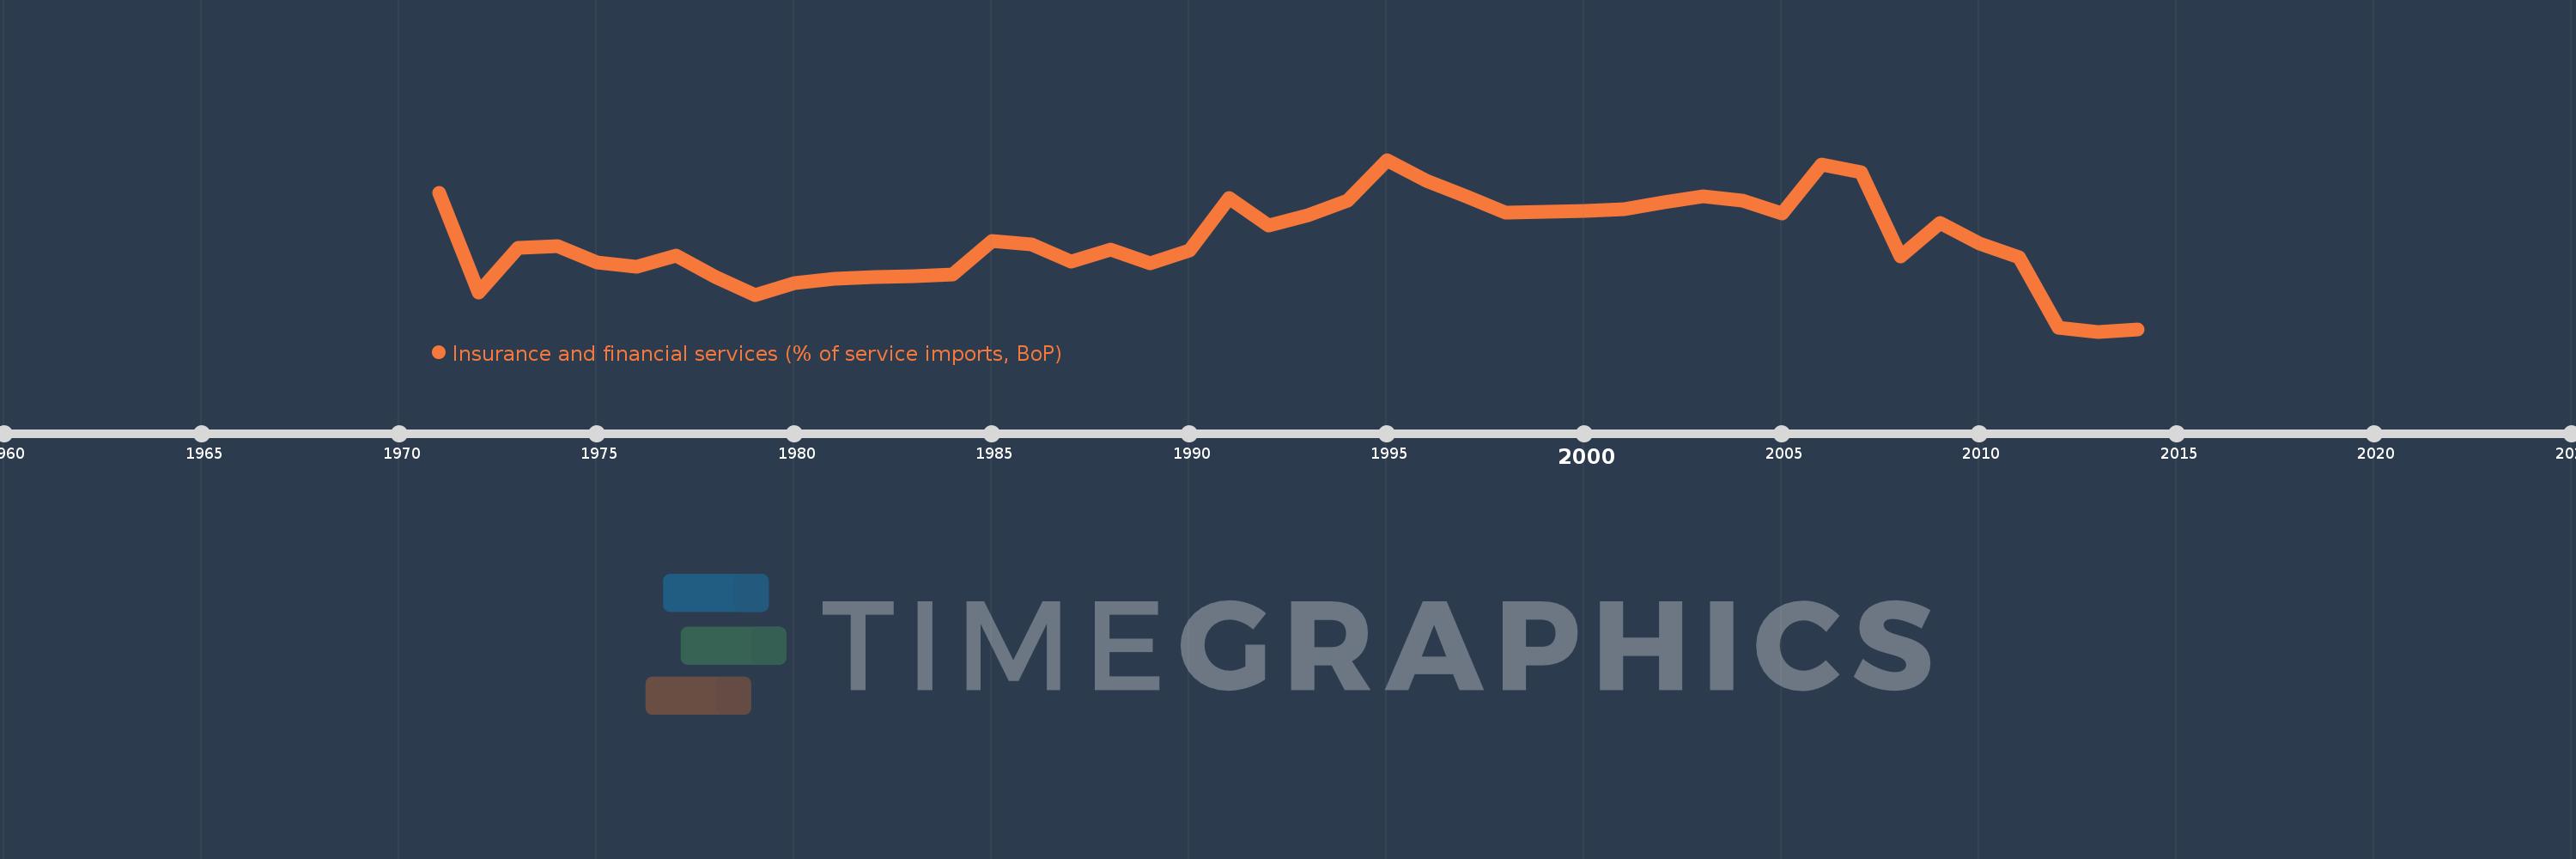
Insurance and financial services (% of service imports, BoP)
2014,2013,2012,2011,2010,2009,2008,2007,2006,2005,2004,2003,2002,2001,2000,1999,1998,1997,1996,1995,1994,1993,1992,1991,1990,1989,1988,1987,1986,1985,1984,1983,1982,1981,1980,1979,1978,1977,1976,1975,1974,1973,1972,1971
Diese Statistik in anderen Ländern:
AfghanistanAlbaniaAlgeriaAngolaAntigua and BarbudaArab WorldArgentinaArmeniaArubaAustraliaAustriaAzerbaijanBahamas, TheBahrainBangladeshBarbadosBelarusBelgiumBelizeBeninBermudaBhutanBoliviaBosnia and HerzegovinaBotswanaBrazilBrunei DarussalamBulgariaBurkina FasoBurundiCabo VerdeCambodiaCameroonCanadaCaribbean small statesCentral African RepublicCentral Europe and the BalticsChadChileChinaColombiaComorosCongo, Dem. Rep.Congo, Rep.Costa RicaCote d'IvoireCroatiaCuracaoCyprusCzech RepublicDenmarkDjiboutiDominicaDominican RepublicEarly-demographic dividendEast Asia & PacificEast Asia & Pacific (excluding high income)East Asia & Pacific (IDA & IBRD countries)EcuadorEgypt, Arab Rep.El SalvadorEquatorial GuineaEritreaEstoniaEthiopiaEuro areaEurope & Central AsiaEurope & Central Asia (excluding high income)Europe & Central Asia (IDA & IBRD countries)European UnionFaroe IslandsFijiFinlandFragile and conflict affected situationsFranceFrench PolynesiaGabonGambia, TheGeorgiaGermanyGhanaGreeceGrenadaGuatemalaGuineaGuinea-BissauGuyanaHaitiHeavily indebted poor countries (HIPC)High incomeHondurasHong Kong SAR, ChinaHungaryIBRD onlyIcelandIDA & IBRD totalIDA onlyIDA totalIndiaIndonesiaIran, Islamic Rep.IraqIrelandIsraelItalyJamaicaJapanJordanKazakhstanKenyaKiribatiKorea, Rep.KosovoKuwaitKyrgyz RepublicLao PDRLate-demographic dividendLatin America & Caribbean Latin America & Caribbean (excluding high income)Latin America & the Caribbean (IDA & IBRD countries)LatviaLeast developed countries: UN classificationLebanonLesothoLiberiaLibyaLithuaniaLow & middle incomeLow incomeLower middle incomeLuxembourgMacao SAR, ChinaMacedonia, FYRMadagascarMalawiMalaysiaMaldivesMaliMaltaMarshall IslandsMauritaniaMauritiusMexicoMicronesia, Fed. Sts.Middle East & North AfricaMiddle East & North Africa (excluding high income)Middle East & North Africa (IDA & IBRD countries)Middle incomeMoldovaMongoliaMontenegroMoroccoMozambiqueMyanmarNamibiaNepalNetherlandsNew CaledoniaNew ZealandNicaraguaNigerNigeriaNorth AmericaNorwayOECD membersOmanOther small statesPacific island small statesPakistanPalauPanamaPapua New GuineaParaguayPeruPhilippinesPolandPortugalPost-demographic dividendPre-demographic dividendQatarRomaniaRussian FederationRwandaSamoaSao Tome and PrincipeSaudi ArabiaSenegalSerbiaSeychellesSierra LeoneSingaporeSint Maarten (Dutch part)Slovak RepublicSloveniaSmall statesSolomon IslandsSouth AfricaSouth AsiaSouth Asia (IDA & IBRD)South SudanSpainSri LankaSt. Kitts and NevisSt. LuciaSt. Vincent and the GrenadinesSub-Saharan Africa Sub-Saharan Africa (excluding high income)Sub-Saharan Africa (IDA & IBRD countries)SudanSurinameSwazilandSwedenSwitzerlandSyrian Arab RepublicTajikistanTanzaniaThailandTimor-LesteTogoTongaTrinidad and TobagoTunisiaTurkeyTuvaluUgandaUkraineUnited KingdomUnited StatesUpper middle incomeUruguayVanuatuVenezuela, RBWest Bank and GazaWorldYemen, Rep.ZambiaZimbabwe Zeitlinie:
Diese Zeitleiste vorliegt die Graphik ab 1971 J. bis 2014 J. Barbados. Die Angaben bis 1970 J. sind nicht vorhanden. Die Zahl aktueller Beobachtungen nach Daten: 44.
Die Quelle (Bezeichnung):
Kennzahlen der Weltentwicklung
Die Quelle (Einrichtung):
International Monetary Fund, Balance of Payments Statistics Yearbook and data files.
Kategorien:
Economy & Growth, Private Sector, Trade
Es wurde aktualisiert:
23 Apr 2017 Jahr
Kennzahlen der Wertänderungen vom Jahr zum Jahr
Minimum:
4.836
1 Jan 2013 Jahr
Maximum:
31.174
1 Jan 1995 Jahr
Zum Datum der Beobachtung
Wert
Absolute Veränderung
Die Veränderung bezüglich dem vorherigen Wert
1 Jan 1971 Jahr
26.087
+26.087
0.0%
1 Jan 1972 Jahr
10.767
-15.32
-58.73%
1 Jan 1973 Jahr
17.672
+6.905
64.13%
1 Jan 1974 Jahr
17.981
+0.31
1.75%
1 Jan 1975 Jahr
15.401
-2.581
-14.35%
1 Jan 1976 Jahr
14.74
-0.661
-4.29%
1 Jan 1977 Jahr
16.555
+1.816
12.32%
1 Jan 1978 Jahr
13.15
-3.405
-20.57%
1 Jan 1979 Jahr
10.405
-2.745
-20.88%
1 Jan 1980 Jahr
12.271
+1.866
17.94%
1 Jan 1981 Jahr
12.941
+0.67
5.46%
1 Jan 1982 Jahr
13.194
+0.253
1.96%
1 Jan 1983 Jahr
13.351
+0.157
1.19%
1 Jan 1984 Jahr
13.531
+0.18
1.35%
1 Jan 1985 Jahr
18.722
+5.191
38.37%
1 Jan 1986 Jahr
18.214
-0.508
-2.72%
1 Jan 1987 Jahr
15.63
-2.584
-14.19%
1 Jan 1988 Jahr
17.382
+1.752
11.21%
1 Jan 1989 Jahr
15.341
-2.041
-11.74%
1 Jan 1990 Jahr
17.31
+1.969
12.84%
1 Jan 1991 Jahr
25.285
+7.975
46.07%
1 Jan 1992 Jahr
21.084
-4.201
-16.61%
1 Jan 1993 Jahr
22.623
+1.539
7.3%
1 Jan 1994 Jahr
24.921
+2.298
10.16%
1 Jan 1995 Jahr
31.174
+6.253
25.09%
1 Jan 1996 Jahr
27.89
-3.284
-10.53%
1 Jan 1997 Jahr
25.614
-2.276
-8.16%
1 Jan 1998 Jahr
23.046
-2.568
-10.03%
1 Jan 1999 Jahr
23.242
+0.197
0.85%
1 Jan 2000 Jahr
23.333
+0.091
0.39%
1 Jan 2001 Jahr
23.633
+0.3
1.29%
1 Jan 2002 Jahr
24.72
+1.087
4.6%
1 Jan 2003 Jahr
25.556
+0.836
3.38%
1 Jan 2004 Jahr
24.867
-0.689
-2.7%
1 Jan 2005 Jahr
22.976
-1.891
-7.61%
1 Jan 2006 Jahr
30.498
+7.522
32.74%
1 Jan 2007 Jahr
29.249
-1.248
-4.09%
1 Jan 2008 Jahr
16.296
-12.953
-44.29%
1 Jan 2009 Jahr
21.541
+5.245
32.19%
1 Jan 2010 Jahr
18.293
-3.248
-15.08%
1 Jan 2011 Jahr
16.213
-2.08
-11.37%
1 Jan 2012 Jahr
5.406
-10.807
-66.66%
1 Jan 2013 Jahr
4.836
-0.57
-10.55%
1 Jan 2014 Jahr
5.228
+0.393
8.13%
Bewertung der Länder gemäß mit laufender Statistik nach Jahren


Kommentare: