29
/de/
de
AIzaSyAYiBZKx7MnpbEhh9jyipgxe19OcubqV5w
April 1, 2024
76430
Bahamas, The
BHS
true
2
1
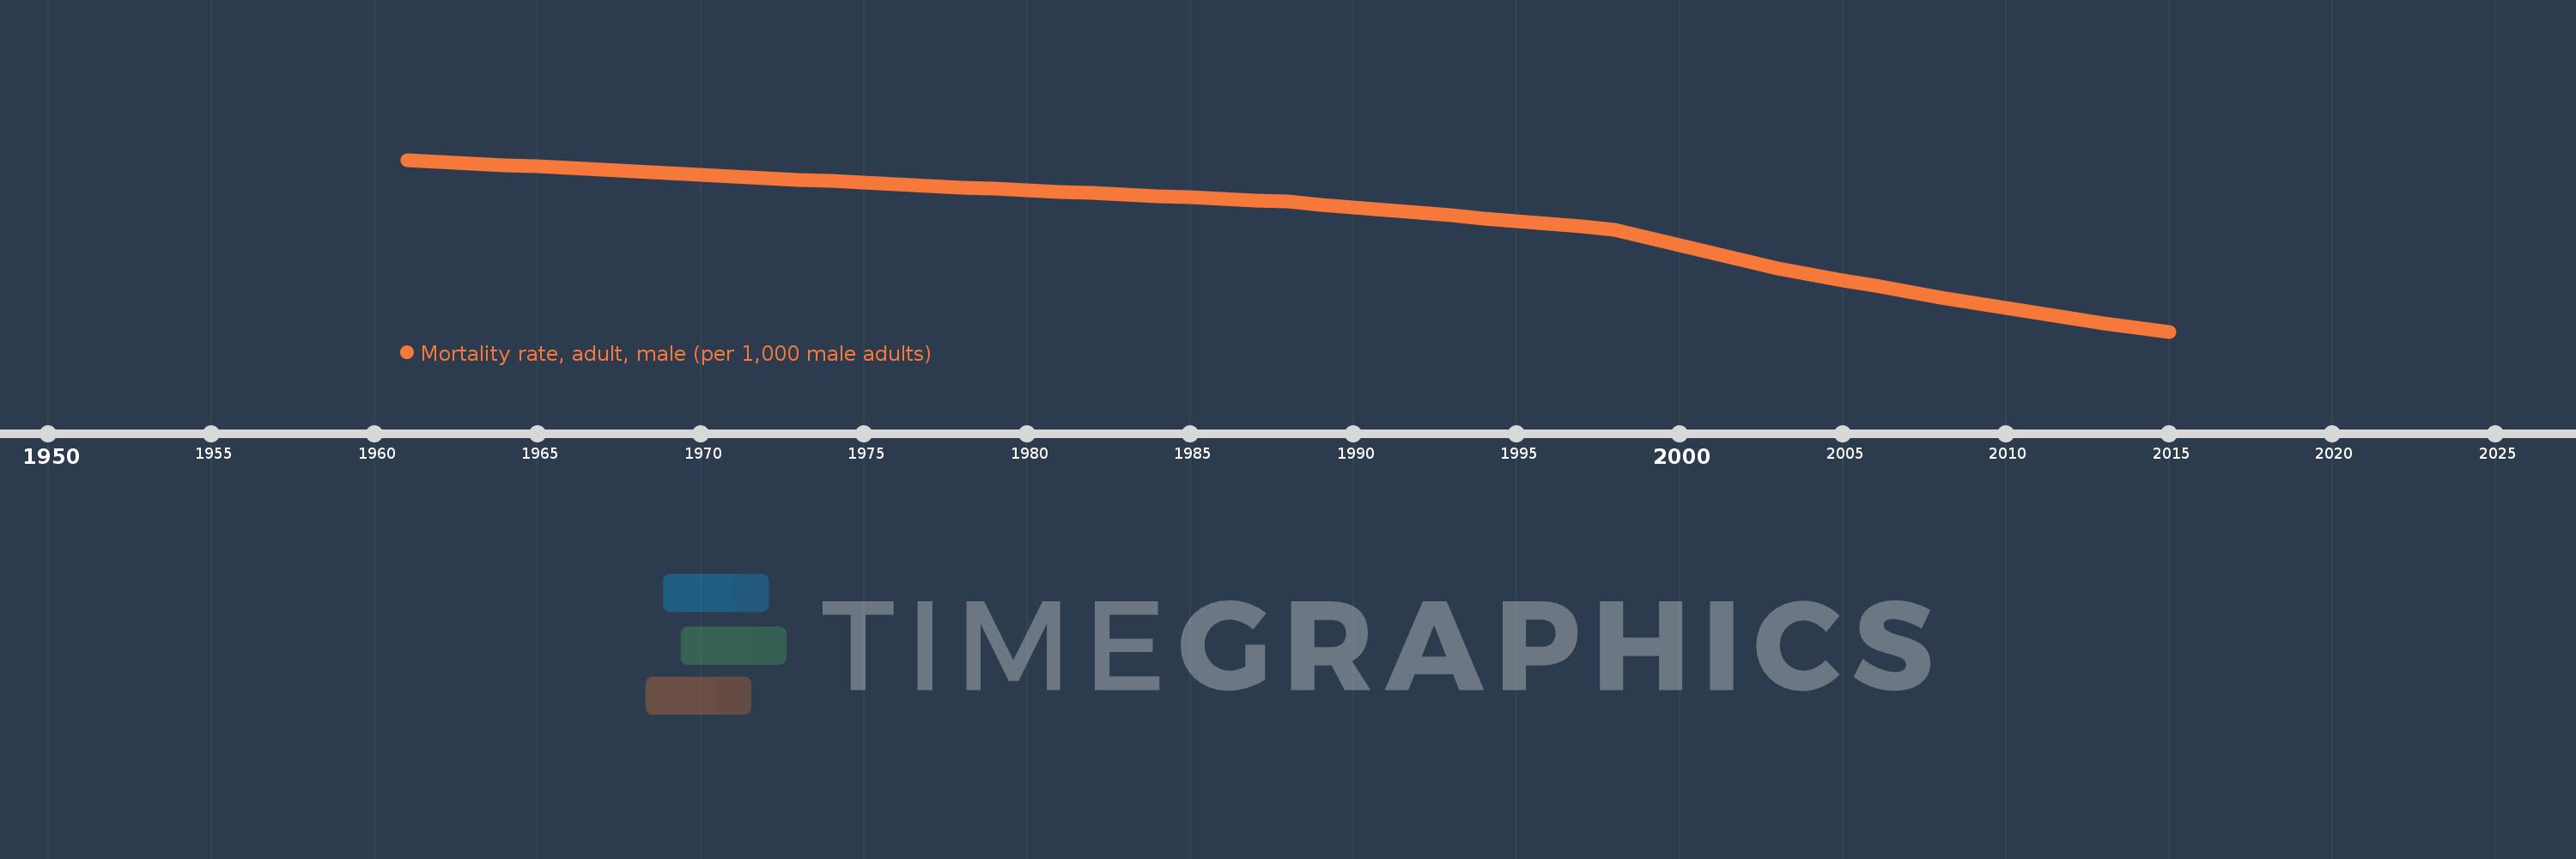
Mortality rate, adult, male (per 1,000 male adults)
2015,2014,2013,2012,2011,2010,2009,2008,2007,2006,2005,2004,2003,2002,2001,2000,1999,1998,1997,1996,1995,1994,1993,1992,1991,1990,1989,1988,1987,1986,1985,1984,1983,1982,1981,1980,1979,1978,1977,1976,1975,1974,1973,1972,1971,1970,1969,1968,1967,1966,1965,1964,1963,1962,1961
Diese Statistik in anderen Ländern:
AfghanistanAlbaniaAlgeriaAngolaAntigua and BarbudaArab WorldArgentinaArmeniaArubaAustraliaAustriaAzerbaijanBahamas, TheBahrainBangladeshBarbadosBelarusBelgiumBelizeBeninBhutanBoliviaBosnia and HerzegovinaBotswanaBrazilBrunei DarussalamBulgariaBurkina FasoBurundiCabo VerdeCambodiaCameroonCanadaCaribbean small statesCentral African RepublicCentral Europe and the BalticsChadChannel IslandsChileChinaColombiaComorosCongo, Dem. Rep.Congo, Rep.Costa RicaCote d'IvoireCroatiaCubaCuracaoCyprusCzech RepublicDenmarkDjiboutiDominicaDominican RepublicEarly-demographic dividendEast Asia & PacificEast Asia & Pacific (excluding high income)East Asia & Pacific (IDA & IBRD countries)EcuadorEgypt, Arab Rep.El SalvadorEquatorial GuineaEritreaEstoniaEthiopiaEuro areaEurope & Central AsiaEurope & Central Asia (excluding high income)Europe & Central Asia (IDA & IBRD countries)European UnionFijiFinlandFragile and conflict affected situationsFranceFrench PolynesiaGabonGambia, TheGeorgiaGermanyGhanaGreeceGreenlandGrenadaGuamGuatemalaGuineaGuinea-BissauGuyanaHaitiHeavily indebted poor countries (HIPC)High incomeHondurasHong Kong SAR, ChinaHungaryIBRD onlyIcelandIDA & IBRD totalIDA blendIDA onlyIDA totalIndiaIndonesiaIran, Islamic Rep.IraqIrelandIsraelItalyJamaicaJapanJordanKazakhstanKenyaKiribatiKorea, Dem. People’s Rep.Korea, Rep.KuwaitKyrgyz RepublicLao PDRLate-demographic dividendLatin America & Caribbean Latin America & Caribbean (excluding high income)Latin America & the Caribbean (IDA & IBRD countries)LatviaLeast developed countries: UN classificationLebanonLesothoLiberiaLibyaLithuaniaLow & middle incomeLow incomeLower middle incomeLuxembourgMacao SAR, ChinaMacedonia, FYRMadagascarMalawiMalaysiaMaldivesMaliMaltaMarshall IslandsMauritaniaMauritiusMexicoMicronesia, Fed. Sts.Middle East & North AfricaMiddle East & North Africa (excluding high income)Middle East & North Africa (IDA & IBRD countries)Middle incomeMoldovaMongoliaMontenegroMoroccoMozambiqueMyanmarNamibiaNepalNetherlandsNew CaledoniaNew ZealandNicaraguaNigerNigeriaNorth AmericaNorwayOECD membersOmanOther small statesPacific island small statesPakistanPanamaPapua New GuineaParaguayPeruPhilippinesPolandPortugalPost-demographic dividendPre-demographic dividendPuerto RicoQatarRomaniaRussian FederationRwandaSamoaSao Tome and PrincipeSaudi ArabiaSenegalSerbiaSeychellesSierra LeoneSingaporeSlovak RepublicSloveniaSmall statesSolomon IslandsSomaliaSouth AfricaSouth AsiaSouth Asia (IDA & IBRD)South SudanSpainSri LankaSt. Kitts and NevisSt. LuciaSt. Vincent and the GrenadinesSub-Saharan Africa Sub-Saharan Africa (excluding high income)Sub-Saharan Africa (IDA & IBRD countries)SudanSurinameSwazilandSwedenSwitzerlandSyrian Arab RepublicTajikistanTanzaniaThailandTimor-LesteTogoTongaTrinidad and TobagoTunisiaTurkeyTurkmenistanUgandaUkraineUnited Arab EmiratesUnited KingdomUnited StatesUpper middle incomeUruguayUzbekistanVanuatuVenezuela, RBVietnamVirgin Islands (U.S.)West Bank and GazaWorldYemen, Rep.ZambiaZimbabwe Zeitlinie:
Diese Zeitleiste vorliegt die Graphik ab 1961 J. bis 2015 J. Bahamas, The. Die Angaben bis 1960 J. sind nicht vorhanden. Die Zahl aktueller Beobachtungen nach Daten: 55.
Die Quelle (Bezeichnung):
Kennzahlen der Weltentwicklung
Die Quelle (Einrichtung):
(1) United Nations Population Division. World Population Prospects. New York, United Nations, Department of Economic and Social Affairs (advanced Excel tables). Available at http://esa.un.org/wpp/unpp/panel_population.htm, (2) University of California, Berkeley, and Max Planck Institute for Demographic Research. Human Mortality Database. [ www.mortality.org or www.humanmortality.de].
Kategorien:
Health, Gender
Es wurde aktualisiert:
23 Apr 2017 Jahr
Kennzahlen der Wertänderungen vom Jahr zum Jahr
Minimum:
200.136
1 Jan 2015 Jahr
Maximum:
284.281
1 Jan 1961 Jahr
Zum Datum der Beobachtung
Wert
Absolute Veränderung
Die Veränderung bezüglich dem vorherigen Wert
1 Jan 1961 Jahr
284.281
+284.281
0.0%
1 Jan 1962 Jahr
283.422
-0.859
-0.3%
1 Jan 1963 Jahr
282.562
-0.86
-0.3%
1 Jan 1964 Jahr
281.742
-0.82
-0.29%
1 Jan 1965 Jahr
280.923
-0.819
-0.29%
1 Jan 1966 Jahr
280.103
-0.82
-0.29%
1 Jan 1967 Jahr
279.284
-0.819
-0.29%
1 Jan 1968 Jahr
278.464
-0.82
-0.29%
1 Jan 1969 Jahr
277.681
-0.783
-0.28%
1 Jan 1970 Jahr
276.898
-0.783
-0.28%
1 Jan 1971 Jahr
276.115
-0.783
-0.28%
1 Jan 1972 Jahr
275.332
-0.783
-0.28%
1 Jan 1973 Jahr
274.549
-0.783
-0.28%
1 Jan 1974 Jahr
273.799
-0.75
-0.27%
1 Jan 1975 Jahr
273.049
-0.75
-0.27%
1 Jan 1976 Jahr
272.3
-0.749
-0.27%
1 Jan 1977 Jahr
271.55
-0.75
-0.28%
1 Jan 1978 Jahr
270.8
-0.75
-0.28%
1 Jan 1979 Jahr
270.08
-0.72
-0.27%
1 Jan 1980 Jahr
269.36
-0.72
-0.27%
1 Jan 1981 Jahr
268.641
-0.719
-0.27%
1 Jan 1982 Jahr
267.921
-0.72
-0.27%
1 Jan 1983 Jahr
267.201
-0.72
-0.27%
1 Jan 1984 Jahr
266.509
-0.692
-0.26%
1 Jan 1985 Jahr
265.817
-0.692
-0.26%
1 Jan 1986 Jahr
265.125
-0.692
-0.26%
1 Jan 1987 Jahr
264.433
-0.692
-0.26%
1 Jan 1988 Jahr
263.741
-0.692
-0.26%
1 Jan 1989 Jahr
262.385
-1.356
-0.51%
1 Jan 1990 Jahr
261.028
-1.357
-0.52%
1 Jan 1991 Jahr
259.672
-1.356
-0.52%
1 Jan 1992 Jahr
258.316
-1.356
-0.52%
1 Jan 1993 Jahr
256.96
-1.356
-0.52%
1 Jan 1994 Jahr
255.59
-1.37
-0.53%
1 Jan 1995 Jahr
254.22
-1.37
-0.54%
1 Jan 1996 Jahr
252.85
-1.37
-0.54%
1 Jan 1997 Jahr
251.48
-1.37
-0.54%
1 Jan 1998 Jahr
250.11
-1.37
-0.54%
1 Jan 1999 Jahr
246.29
-3.82
-1.53%
1 Jan 2000 Jahr
242.469
-3.821
-1.55%
1 Jan 2001 Jahr
238.648
-3.821
-1.58%
1 Jan 2002 Jahr
234.827
-3.821
-1.6%
1 Jan 2003 Jahr
231.007
-3.82
-1.63%
1 Jan 2004 Jahr
228.17
-2.837
-1.23%
1 Jan 2005 Jahr
225.333
-2.837
-1.24%
1 Jan 2006 Jahr
222.497
-2.836
-1.26%
1 Jan 2007 Jahr
219.66
-2.837
-1.28%
1 Jan 2008 Jahr
216.823
-2.837
-1.29%
1 Jan 2009 Jahr
214.281
-2.542
-1.17%
1 Jan 2010 Jahr
211.739
-2.542
-1.19%
1 Jan 2011 Jahr
209.197
-2.542
-1.2%
1 Jan 2012 Jahr
206.655
-2.542
-1.22%
1 Jan 2013 Jahr
204.113
-2.542
-1.23%
1 Jan 2014 Jahr
202.125
-1.988
-0.97%
1 Jan 2015 Jahr
200.136
-1.989
-0.98%
Bewertung der Länder gemäß mit laufender Statistik nach Jahren


Kommentare: